Library

Found and graded S to C by a screening method I built and keep improving. Each source has an English digest and a link to the original.

179 sources so far, updated weekly.

What S, A, B and C mean
Shapes the field 15
Leading researchers, flagship reports from major institutions and consultancies, essays that changed the debate.
Strong evidence 80
Sound method or large documented data; worth reading in full.
Useful, limited 64
Narrow sample, companion material, or practitioner experience without measured outcomes.
Weak signal 20
Secondhand coverage, sales material, or a source whose content could not be reviewed.

Every tier S source, plus the tier A sources that scored highest in the screening. Newest first.

Shapes the field

All 15 tier S
  1. S

    Financing the AI Buildout (w35865)

    Cost per MW: about $11 million for the building, $2 million for power infrastructure, $28 million for GPU racks and IT; a 200 MW campus costs about $8.2 billion, two-thirds of it IT equipment.

    $41 billionestimated cost of a 1 GW AI campus ($41 million per MW)

  2. S

    The AI-as-Normal-Technology view of loss of control incidents

    The Hugging Face incident occurred while OpenAI had monitoring for most internal use but not for evaluations, and the evaluation used a different harness and prompts than production Codex.

    >100xreduction in propensity to compromise out-of-scope infrastructure when OpenAI used its production Codex harness and prompt

  3. S

    Economic Scenarios for Transformative AI

    Modest: AI touches 4% of task instances by 2030; GDP +1.6%, growth 2.4% a year instead of 2%, labor share 60.0% to 59.4%, unemployment 3.9% against a normal 3.8%.

    +8.3%GDP above the no-AI path in 2030, substantial scenario; the median US adult's answers imply +8.6%

  4. S

    The state of AI in 2026: On the road to ROI

    44% say AI is scaling across the enterprise, up from 38%; 56% use AI in three or more functions, up from 51%; nearly nine in ten use it in at least one function.

    37%respondents attributing any EBIT impact to AI, unchanged from 2025

  5. S

    We Must Act Now

    The full text is one paragraph of about 100 words, followed by a signature list of more than 200 names.

    17signatories marked as Nobel laureates on the published list

  6. S

    Employment Outlook 2026

    Average OECD employment rate reached 72.1% in Q1 2026 and labour force participation 76.7%; the median unemployment rate rose from 5.4% in May 2025 to 5.7% in May 2026.

    72.1%average OECD employment rate in Q1 2026, a historic high

  7. S

    2026 Global AI Jobs Barometer

    22% of advertised jobs are professionalised, 52% democratised and 26% have low AI exposure.

    22% vs 52%share of advertised jobs AI is professionalising (more expert) vs democratising (less expert)

  8. S

    AI Index Report 2026

    Generative AI reached 53% population adoption within three years, faster than the PC or the internet; organizational adoption reached 88%.

    88%organizational adoption of AI in 2025

  9. S

    Firm data on AI

    69% of firms use AI on average: US 78%, UK 71%, Germany 65%, Australia 59%.

    69%firms across the US, UK, Germany and Australia that currently use AI

  10. S

    Building pro-worker AI

    Five categories of technological change: labour-augmenting, capital-augmenting, automating, expertise-leveling and new task-creating.

    52%US workers surveyed in 2024 who are worried about how AI will affect their jobs

Strongest of tier A

All 80 tier A
  1. A

    How AI helps test a large product

    An AI pre-analysis of about 26 critical components, checked by component owners, produced a database of scenarios and test cases with priorities; the video description cites 28 components in five languages and more than 11,000 test cases, the talk more than 13,000.

    70%pipeline runs that produced a successful merge request, out of about 1,500

  2. A

    Can AI automate Epoch?

    Task suite: 11 tasks in five categories; models tested on Codex, Claude Code, Grok Build, Antigravity, Kimi Code and Qwen Code at their highest reasoning settings.

    11 tasksreal Epoch work tasks across five categories in the launch suite

  3. A

    Gave nine popular Claude Code skills a placebo

    Skills chosen by GitHub stars on 28 September 2026, from superpowers (292,189) to compound-engineering (25,299); domain skills, memory systems and orchestrators excluded.

    2 of 9popular Claude Code skills that beat a length-matched placebo, both on cost only (12% and 5% cheaper)

  4. A

    Can AI automate AI R&D yet? (InnovationEval)

    Each agent received 3,000 GPU-hours on up to 50 GPUs and a 10 billion-token inference budget, in a sandbox without internet access, with a codebase scrubbed of SDPO.

    35%share of the human method's gains reached by the best uncontaminated model (GPT-5.6 Sol), scored generously; 15% when only in-scope changes count

  5. A

    Claude Haiku 5.5 System Card

    Knowledge cutoff June 2026; text output only.

    1620 vs 735GDPval-AA v2.1 Elo on professional tasks for Haiku 5.5 versus Haiku 4.5 (Sonnet 5.5: 1840)

  6. A

    How we launched an AI reviewer on 4,000 PRs a day

    About 4,000 PRs a day pass through NeuroReview, roughly 40% of PRs created in Arcadia; use is voluntary and internal only.

    ~4,000pull requests a day reviewed by NeuroReview, about 40% of all PRs in Yandex's Arcadia monorepo

  7. A

    What Does a Harness Buy? Tokens, Mostly

    On 447 tasks, Claude Code and mini-SWE-agent differ by -1.8 points (Qwen3.6-35B-A3B) and -1.4 points (Qwen3.8-27B), equivalent within a 5-point margin.

    13%median share of hard tasks whose outcome flips, both when swapping the harness and when rerunning the same one

  8. A

    Periodic Weak Spots: Phase Sensitivity from Chunked KV-Cache Compression

    In DeepSeek-V4-Flash-Base, a code completion flips between the correct "8" and the wrong "32" with a period of four tokens as filler text is lengthened, matching the compression stride of 4.

    40.2 pplargest gap in 128K-context retrieval accuracy across token phases in DeepSeek-V4 base models

All 179 sources, with filters Browse by week

More figures from graded sources

Figures as the sources published them. Each opens the digest; the credit names the original.

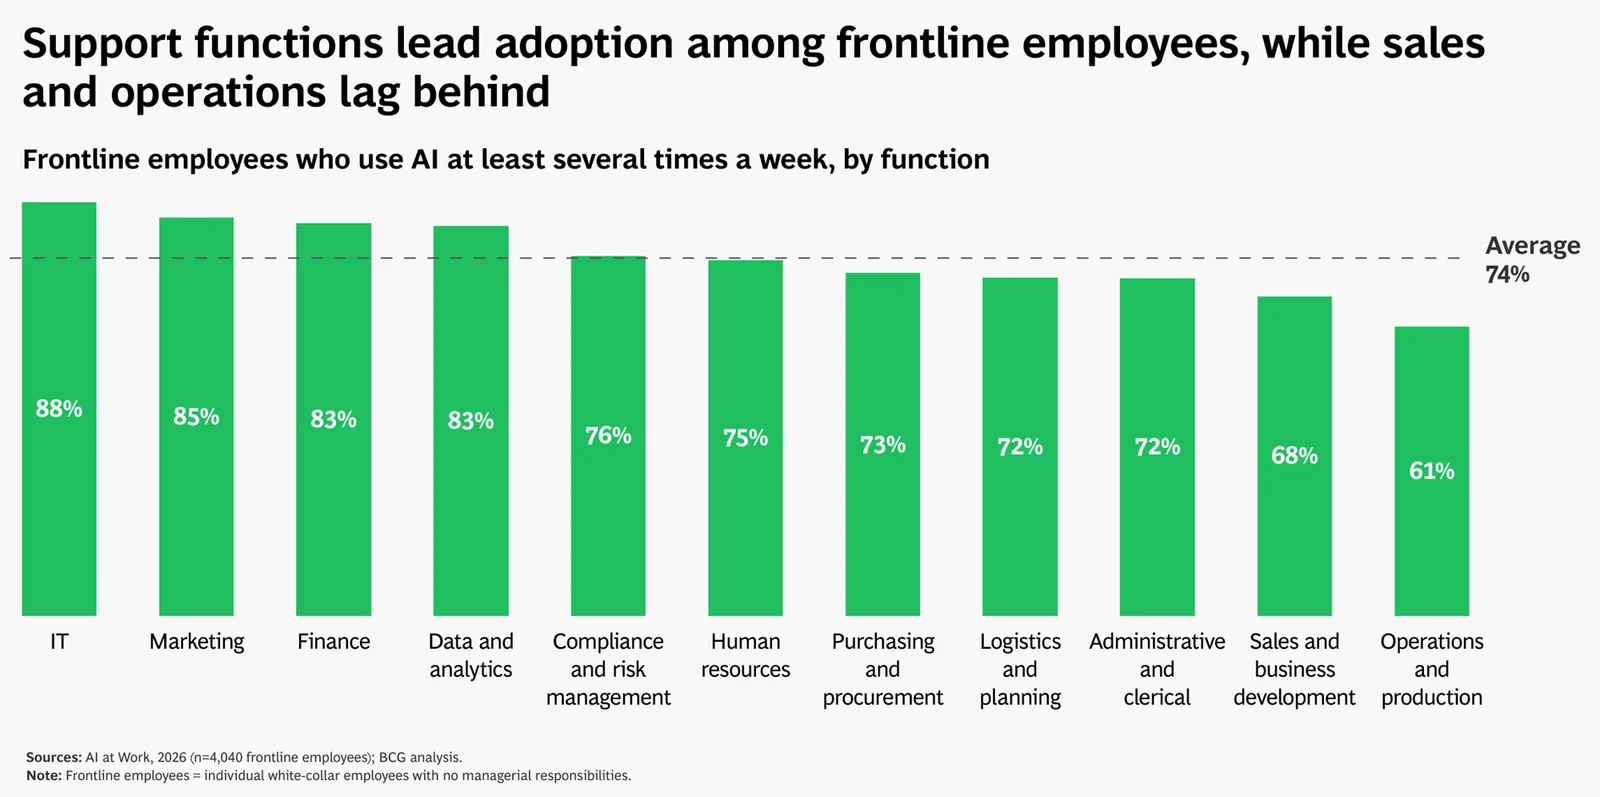
Exhibit 1

Frontline AI use by function

Column chart. Frontline employees who use AI at least several times a week, by function: IT 88%, Marketing 85%, Finance 83%, Data and analytics 83%, Compliance and risk 76%, Human resources 75%, Purchasing 73%, Logistics 72%, Administrative 72%, Sales 68%, Operations and production 61%. Average 74%.
Support functions lead; sales and operations trail the 74% average. Source: BCG, AI at Work 2026, June 2026 (n=4,040 frontline employees).

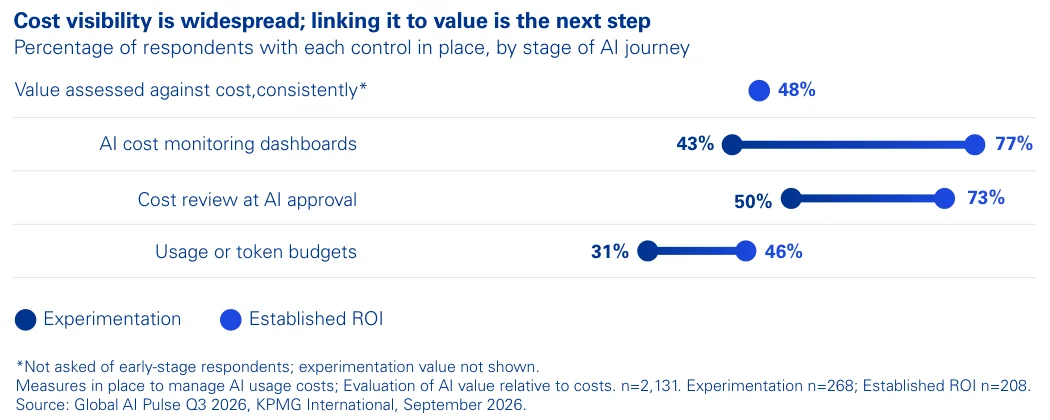
Exhibit 2

Cost controls by stage of AI journey

Dot chart. Share of respondents with each control in place, experimentation vs established ROI: AI cost monitoring dashboards 43% vs 77%, cost review at AI approval 50% vs 73%, usage or token budgets 31% vs 46%. Value assessed against cost consistently: 48% of established-ROI respondents.
Firms with established ROI run cost dashboards far more often (77% vs 43%). Source: KPMG International, Global AI Pulse Q3 2026, September 2026 (n=2,131).

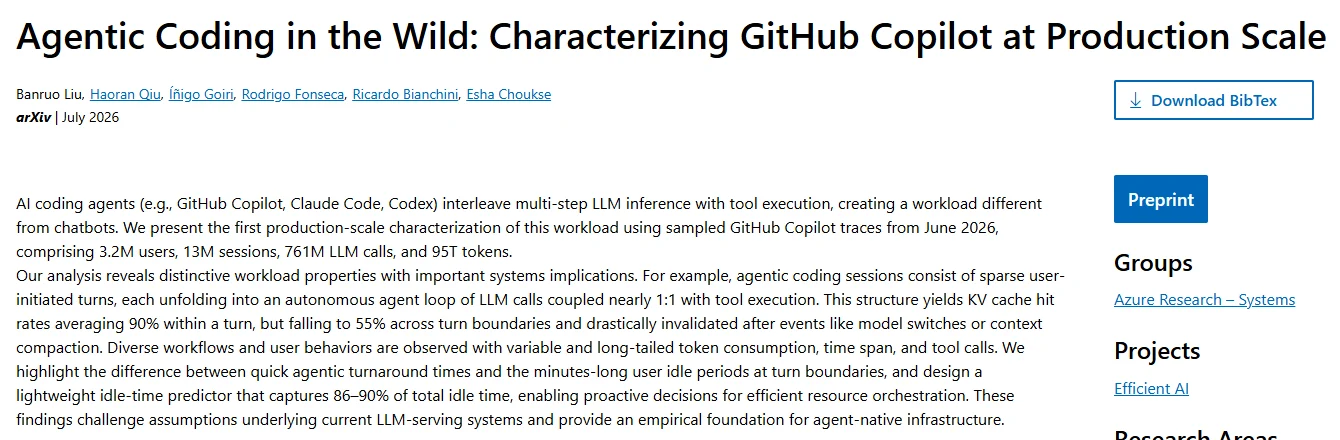
Exhibit 3

The paper page and abstract

Screenshot of the Microsoft Research page for "Agentic Coding in the Wild: Characterizing GitHub Copilot at Production Scale", July 2026, showing the authors and the abstract: 3.2M users, 13M sessions, 761M LLM calls and 95T tokens from sampled GitHub Copilot traces.
The scale of the trace sample: 3.2M users, 13M sessions, 761M LLM calls. Source: Microsoft Research, Agentic Coding in the Wild, July 2026. Page capture.