Global AI Pulse Q3 2026
A · Strong evidence A large, documented quarterly executive survey (2,131 senior leaders, 20 countries) from a Big Four firm with stated bases per figure, but all outcomes are self-reported and KPMG sells the remedies it recommends.
Summary based on the full text·Original: about 40 minutes to read
In short
The third 2026 edition of KPMG International's Global AI Pulse (September 2026), a survey of 2,131 senior leaders in 20 countries. The question has moved from orchestration (Q1) and value realization (Q2) to what running AI at scale requires. Its main finding: most firms now see what AI costs and say it creates value, but only 12% consistently judge that value against the cost. Regional maturity gaps have closed from 16 to 8 points, so KPMG argues the advantage shifts from being early to running AI well.
Key numbers
- 12% vs 89%organizations that consistently assess AI value against cost vs organizations reporting measurable value from AI
- 55% / 86%operate a formal AI harness layer, whole sample / organizations with established ROI
- 23%include model routing in their AI management layer, the least common capability
- US$210Maverage planned AI investment over the next 12 months, up from US$186M in Q1
As reported by the source.
English·PDF·opens assets.kpmg.com
Figure from the source
Exhibit 1
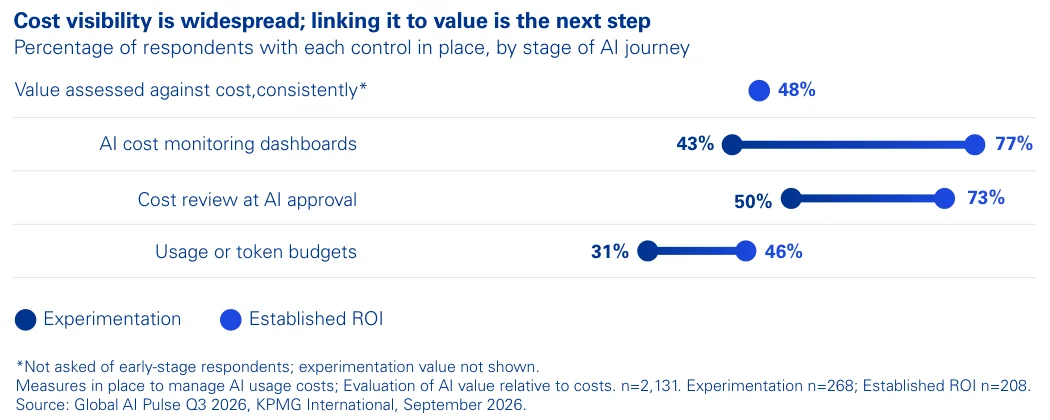
Cost controls by stage of AI journey
What it reports
- Scaling AI or beyond: Americas 64%, Asia Pacific 61%, EMEA 56% (Q1: 56%, 43%, 40%). Experimenters fell from 22% to 13%; established ROI rose from 8% to 10%.
- Planned investment: global US$210M (+13%), EMEA US$203M (+29%), Americas US$191M (+7%), Asia Pacific US$246M (unchanged).
- AI harness layer: 55% formal; 5% no formal approach. Among established-ROI firms 86% formal, 65% enterprise-wide; among experimenters 31% and 10%.
- Layer contents: security and identity 43%, data access 43%, output monitoring 41%, cost tracking 37%, human review 34%, model routing 23% (17% of experimenters, 41% of established-ROI).
- Accountability for AI-informed decisions at C-suite level or above: 53% (35% a named executive, 18% CEO or executive committee).
- Significant employee adoption of agents: 34%, up from 25% in Q1; 48% in established-ROI firms vs 15% at proof of concept.
- Cyber: 71% of established-ROI firms put cyber and data security in the AI budget vs 36% of experimenters; AI-assisted cyber defense 58% vs 8%.
- Sovereignty: 21% enterprise-wide strategy, 51% formal criteria on most or selected decisions, 8% slowed deployment because of it.
- Cost: 61% review costs at approval, 59% monitor in operation, 12% consistently assess value against cost (48% among established-ROI firms).
How they got it
Online survey fielded 23 July to 26 August 2026 among presidents, C-suite, SVPs, VPs and directors reporting to the C-suite (Americas n=670, Asia Pacific n=540, EMEA n=921). Companies needed at least US$50M revenue, or US$100M in ten larger markets. The maturity comparison sets experimenters (n=268) against firms reporting established ROI (n=208). Investment figures are weighted means adjusted for size and region.
Limits
- "Measurable value" and "established ROI" are self-assessed; no financial verification.
- Maturity-stage comparisons are correlations; firms reporting ROI may simply be larger or better run.
- KPMG notes that quarter-on-quarter moves are small and should be read as direction, and the report closes with KPMG's own service offer.
Why it matters for companies
The useful number is the 12%: most firms can show AI spend but cannot link it to outcomes, which leaves budget decisions to opinion. The report gives a concrete checklist for the management layer: controls, routing work to the cheapest adequate model, a named accountable executive, and cost tied to outcomes. Firms relying on one model provider carry operational, legal and commercial risk in one place; the most mature group spreads it. A traditional company can set up the cost-to-value link before scaling further, since retrofitting it later is harder.
Summary based on the full text. Read the original for the full argument and data.Open PDF on assets.kpmg.com