- Library
- Numbers
Numbers
The numbers worth remembering from the sources in the Library: adoption, productivity, cost, jobs and capability. Each one is checked against the source summary, dated, graded and linked. The page grows every week.
As of : 481 verified numbers from 155 sources in the Library; 43 come from tier S and 244 from tier A.
Chart 1
The record grows each month
Verified numbers by the month their source was published, stacked by tier.
- Tier S, shapes the field
- Tier A, strong evidence
- Tier B, useful, limited
Headline numbers
Adoption
32%
Organizations that decided against buying software because they could build it with agentic coding tools
McKinsey S
Productivity and returns
3.22%
Average annual share of GDP, above railroads 1870-1890 (2.24%) and telecom/fiber 1996-2003 (1.10%)
Jobs and skills
2%
Largest average effect on earnings or hours that the estimates still allow, for workers and workplaces
Cost and investment
77%
Respondents reporting no change in current labour costs from AI use
The newest number from a tier S source in each of four topics; tier A when no S source has one.
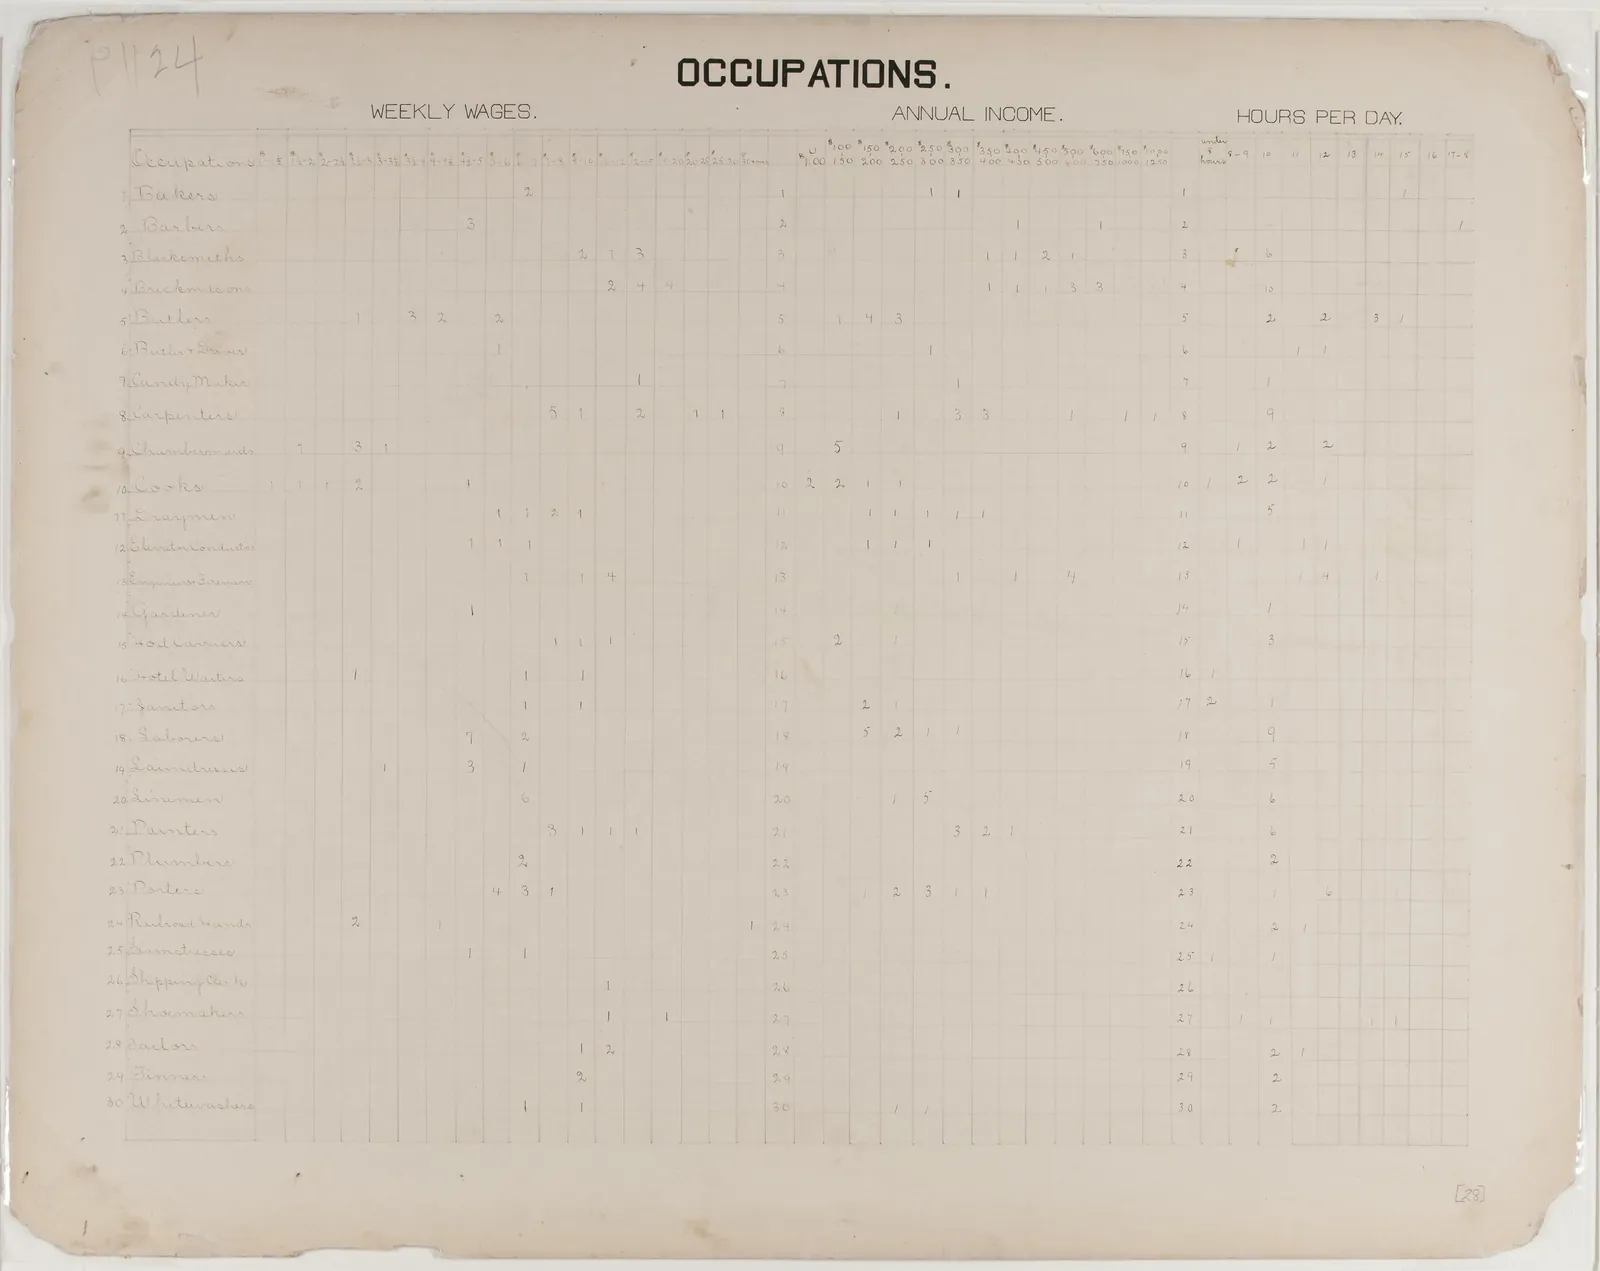
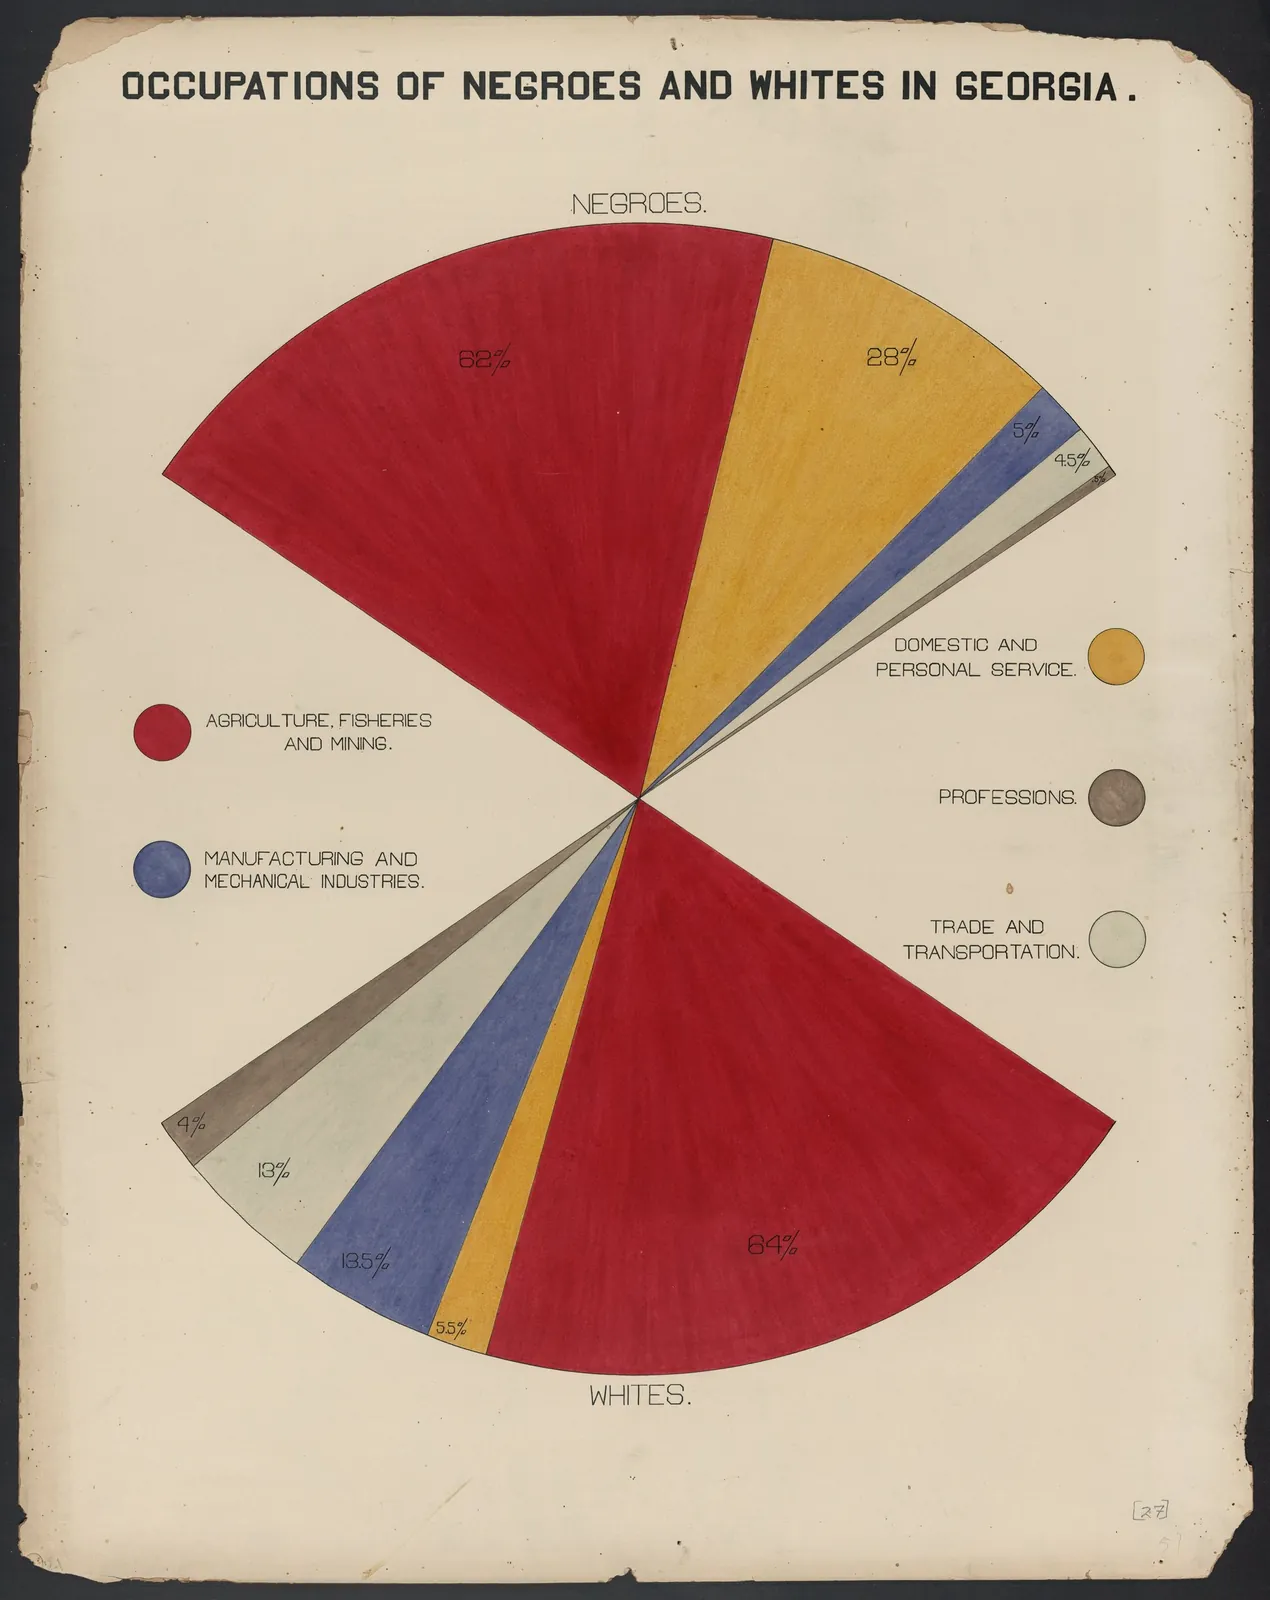
How a register was kept in 1900
Every number here carries its unit, its source and its date. The Atlanta University team did the same by hand for the Paris Exposition of 1900: a tabulation sheet with the unit on every column, and a chart from the same series.


Adoption
99 numbersWho uses AI at work, and how far it has spread.
Chart 2
Adoption: the shares on record
Percent, 0 to 100. One bar per finding, sorted by value. Each bar measures something different: read its label. Red bars come from tier S sources.
Organizational adoption of AI in 2025
88% Stanford HAI SUSPTO patent examiners using AI-based search features as of June 2024
almost 80% NBER SFirms across the US, UK, Germany and Australia that currently use AI
69% NBER SSteps users were happy to fully delegate without notice
63.9% KAIST ASurveyed professionals expecting AI to lower their income
39% ILO AOrganizations that decided against buying software because they could build it with agentic coding tools
32% McKinsey SWho fully or somewhat trust AI to make fair and unbiased decisions (32% in 2025)
28% SCSP / Gallup AShare of warranted cases models self-report when tool use is optional
~16% arXiv A
No numbers of the chosen tier in this chart.
Chart 3
Adoption: changes, gaps and ranges
Percent, 0 to 100. Two values reported together by one source, drawn to scale.
- Change: from the hollow dot to the arrow
- Comparison: red is the first group named, navy the second
- Range: low to high estimate
ChangeUS adults using AI sometimes or more, 2025 to 2026
39% to 51% SCSP / Gallup AChangeIndividual users sending at least one task estimated at 8+ human hours, Dec 2025 to May 2026
2.1% to 25.6% OpenAI AComparisonOECD countries using AI in health administration vs national-level scale-up of medical imaging AI
100% vs 10% OECD AComparisonRespondents who call decision-making very important to AI success versus those reporting great progress on it
64% vs 5% Deloitte BRangeLeaders expecting at least half of processes redesigned around agents within two years vs four years
31% → 74% Deloitte BComparisonRespondents personally ready for AI vs leaders who say their organisation is ready
70% vs 27% McKinsey BChangeShare of firms in OECD countries using AI, 2021 to 2025
7% to 20% OECD BRangeStudents using AI for homework help, May to December 2025 (RAND, cited)
48% to 62% World Economic Forum B
No numbers of the chosen tier in this chart.
Exhibit 1 · Survey · BCG
Frontline AI use by function
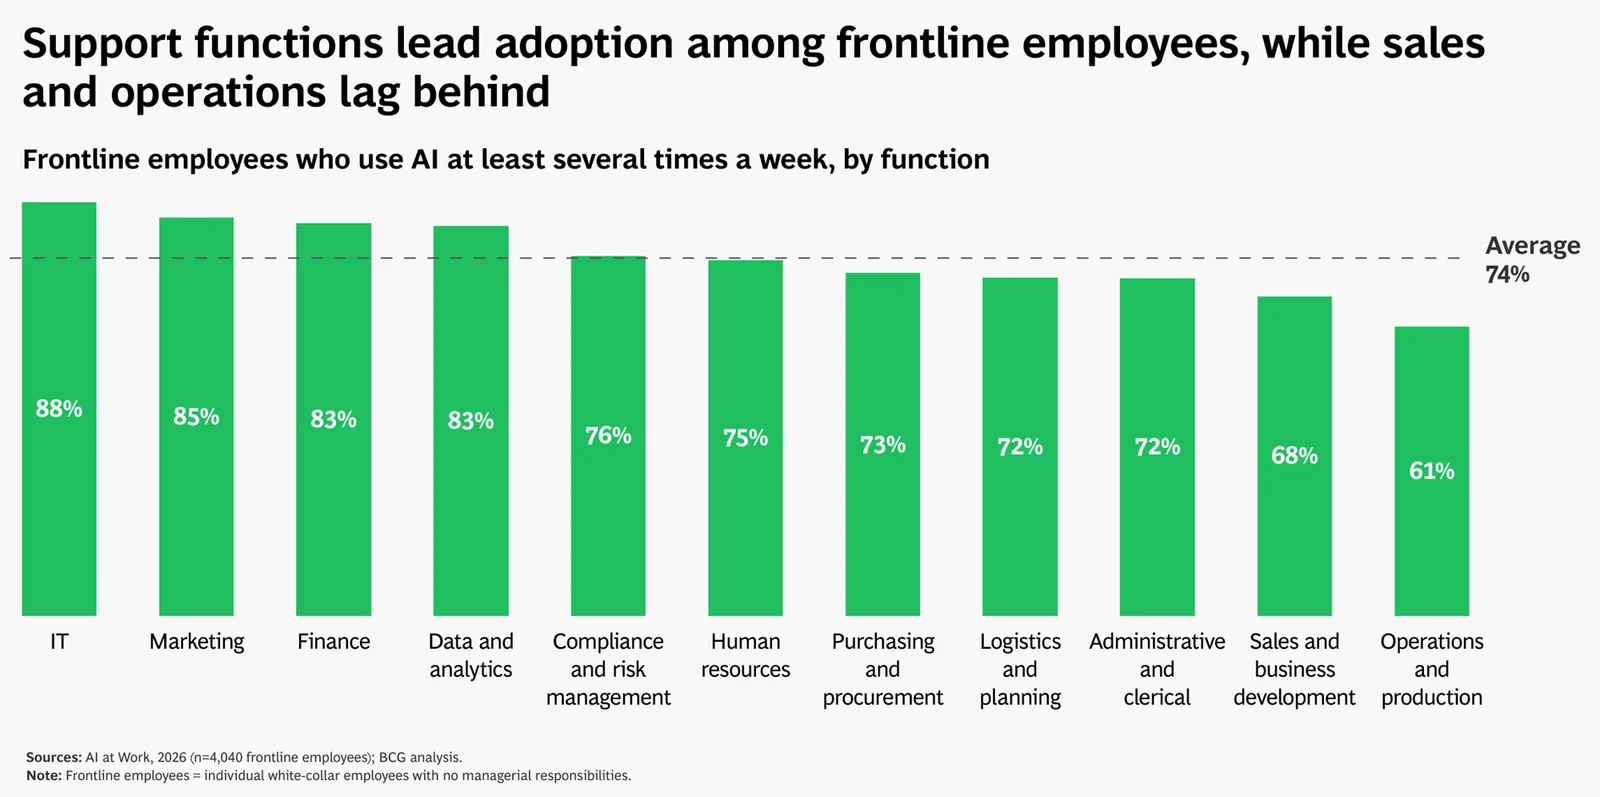
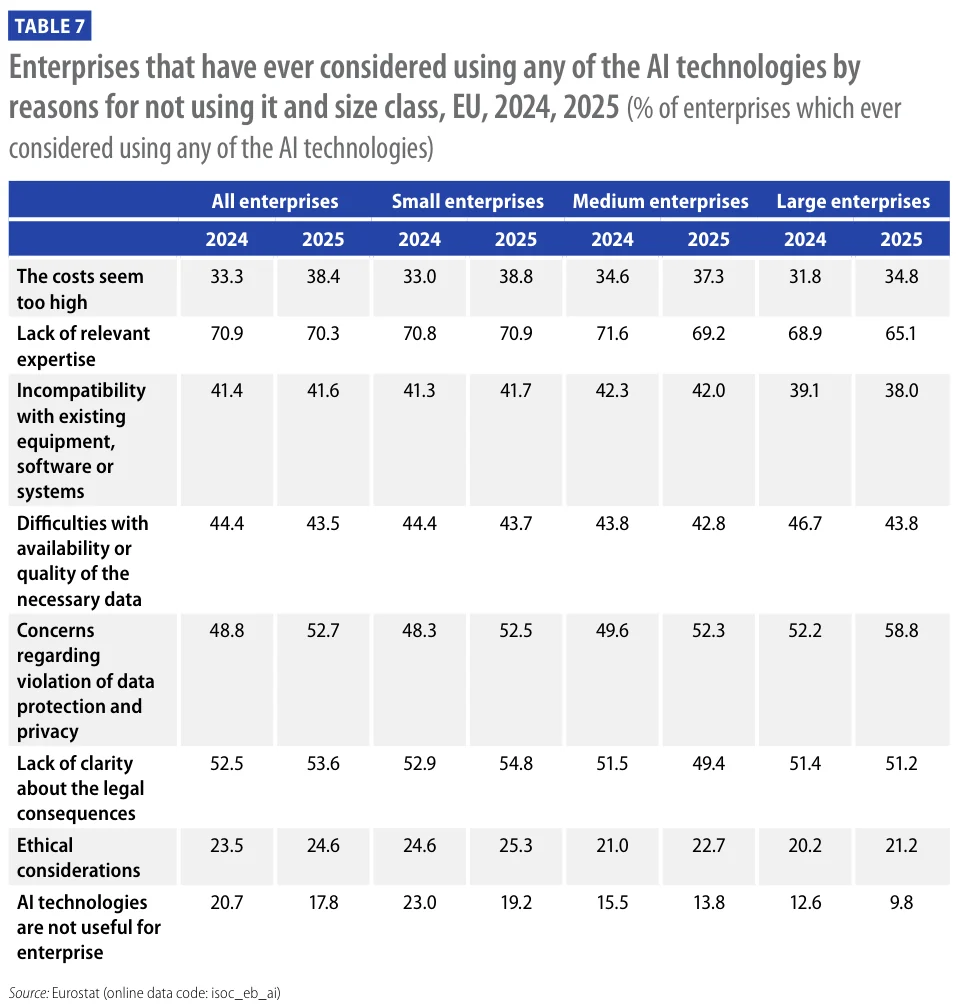
Exhibit 2 · Official statistics · Eurostat
Why EU firms that considered AI did not use it
All 99 numbers on adoptionnewest first
| Number | What it measures | Source | Date | Tier |
|---|---|---|---|---|
| 12,000 | Active users, mostly contact-centre operators, out of 75,000+ with access | DevOops | B | |
| 2 | Commands in the whole agent interface: start a session, run a Python script | LLM под капотом (Telegram, Rinat Abdullin) | B | |
| 2x | Reduction in agents' idle wandering time after about five SDK optimisation experiments | LLM под капотом (Telegram, Rinat Abdullin) | B | |
| ~1,000x | Token reduction for typical agent tasks reported for Cloudflare's Code Mode approach | LLM под капотом (Telegram, Rinat Abdullin) | B | |
| ~99% | His estimate of coding-agent penetration among developers | 硅谷101播客 Silicon Valley 101 | B | |
| 2,209 | Agents in the swarm, exchanging 16,758 agent-to-agent messages and using 228.70B tokens | Prime Intellect | B | |
| 69+ | Merged performance changes from 144+ experiment and audit records in a 3-day agent loop | Prime Intellect | B | |
| 13 GB vs 50 KB | Files an agent downloads for an unused feature versus the gzipped self-documentation it lacks | Michael Lynch (mtlynch.io) | B | |
| 30+ | Products Guo Yu built alone with coding agents in roughly three to four months, many unreleased | INDIGO 数字镜像 (Indigo Talk) | B | |
| half a day | Time for one or two people to run what used to be a two-week team iteration cycle | INDIGO 数字镜像 (Indigo Talk) | B | |
| 2-3% | Guo's estimate of what AI can do in organisations that has actually been done, as of October 2026 | INDIGO 数字镜像 (Indigo Talk) | B | |
| Category 5 | IO Breakout Scale rating of the Russia-origin 'Dark Clark' operation, the first Category 5 operation OpenAI has disrupted | OpenAI | B | |
| 6.5 -> 3.5 min | Time for the agent to file a conversation note before and after switching to server-side Python | LLM под капотом (Telegram, Rinat Abdullin) | B | |
| 60 of 60 | Submissions paid despite instructions explicitly prohibiting AI use | UPenn et al. | A | |
| 7 hours | Time the agent spent compiling a dossier on its owner before halting | Yandex for ML (Practical ML Conf) | B | |
| 6.07 vs 4.97 | Expected boost to willingness from being credited for reuse, AI versus human condition, 1-7 scale (g = 1.30) | NUS / Emory | A | |
| 1.41-3.31x | Token usage of concurrent versus sequential execution across agents | Fudan University | A | |
| 1221 | Problems hosted on erdosproblems.com, with over 9000 comments and almost 2000 registered users | Erdos Problems (Thomas Bloom) | B | |
| 291 | Proof claims on the site at the time of the change, 155 with zero comments (count by a forum user) | Erdos Problems (Thomas Bloom) | B | |
| 91-94% | Share of DDR3 peak bandwidth used while decoding with the current production build | FeSens (GitHub) | B | |
| 55 | Editors who used WikiVault in its first ten months (0.12% of active editors) | Princeton et al. | A | |
| 34 / 27 days | Recent doubling time for median and 90th-percentile users | Epoch AI | B | |
| 28,554 | Changes where developers applied an agent fix, out of 295,508 that received one | A | ||
| 9.85 min | Median time for the agent to produce a successful fix | A | ||
| millions | Automated API requests and crawled pages attributed to OpenAI-operated agents | Wikimedia Foundation | B | |
| 50% | Rise in Wikimedia bandwidth use from bot activity since 2024, reported in 2025 | Wikimedia Foundation | B | |
| 63.9% | Steps users were happy to fully delegate without notice | KAIST | A | |
| ~16% | Share of warranted cases models self-report when tool use is optional | arXiv | A | |
| about 5 weeks | Time after which forecast uncertainty reaches the largest observed deploy effect | arXiv (micro1 data) | A | |
| 1-3 months | Time to build a company's ontology, per Kai-Fu Lee (01.AI) | 量子位 QbitAI | B | |
| 0 of 33 | Mandate-adherent portfolios when the agent ran a nine-stage chain on its own handoffs | arXiv | A | |
| about half a billion | Tokens used per month, roughly 95% of them cache reads | Гриненко про (Yandex speaker) | B | |
| 10 rounds | Longest observed back-and-forth between reviewer and implementer agents | Гриненко про (Yandex speaker) | B | |
| 48% | Fall in the number of firms newly adopting generative AI from the April 2026 peak | Revelio Labs | B | |
| about 1,200 | Agents in the July 2026 incident that shared information on a message board | arXiv | A | |
| 58% | Of 3,000 C-suite leaders plan to change how work is split between people and AI in the next 12 months | Accenture | B | |
| 35% | Organizations already running agentic AI in production (BCG and MIT Sloan Management Review) | BCG | B | |
| 44% | Organizations planning agent deployments | BCG | B | |
| 23 of 31 | Countries where the junior share fell, significant in seven including the US, Brazil and Saudi Arabia | Stanford Digital Economy Lab | A | |
| 39% to 51% | US adults using AI sometimes or more, 2025 to 2026 | SCSP / Gallup | A | |
| 28% | Who fully or somewhat trust AI to make fair and unbiased decisions (32% in 2025) | SCSP / Gallup | A | |
| $1 billion | OpenAI cyberdefense initiative, mostly in usage credits rather than cash | Kapoor and Narayanan | S | |
| 64% vs 5% | Respondents who call decision-making very important to AI success versus those reporting great progress on it | Deloitte | B | |
| ~70% | Respondents naming an inability to trust and govern agents as a major barrier to value | Deloitte | B | |
| ~10,000 | Concurrent agents in the group that produced the Navier-Stokes resolution | OpenAI | B | |
| 88 hours | From first agent launch to resolution on 5 September; Lean formalization took 17 more hours | OpenAI | B | |
| 39% | Surveyed professionals expecting AI to lower their income | ILO | A | |
| 10,980 | US adults surveyed in August 2026; the typical answer implies the substantial scenario | Anthropic Institute | B | |
| ~10% | Share of respondents whose views match the extreme scenario | Anthropic Institute | B | |
| 32% | Organizations that decided against buying software because they could build it with agentic coding tools | McKinsey | S | |
| 266 vs 21 | Vulnerabilities found by a 45-agent coordinating swarm (27M tokens) vs independent parallel agents (6.5M tokens), Mythos Preview | Anthropic | A | |
| 18 of 30 | Agents that independently chose the identical git branch name "mvp-game-loop" | Anthropic | A | |
| 31% → 74% | Leaders expecting at least half of processes redesigned around agents within two years vs four years | Deloitte | B | |
| 0.171 SD | Unassisted follow-up gain for lower-education participants after AI use | arXiv | A | |
| 11.6% | Users applying generative AI to most or almost all of their tasks | Statistics Canada | A | |
| 56.0% | Non-users who say generative AI has no applicability to their work | Statistics Canada | A | |
| 3% | Organisations reporting leaders highly prepared to manage AI-enabled ways of working | Manpower Everest | B | |
| 11% | Leaders who say their organisation is in the reinvention horizon | McKinsey | B | |
| 70% vs 27% | Respondents personally ready for AI vs leaders who say their organisation is ready | McKinsey | B | |
| 30% | Median probability surveyed experts gave that an agent would reach weak accept or better | arXiv | A | |
| 7% to 20% | Share of firms in OECD countries using AI, 2021 to 2025 | OECD | B | |
| 17.3% | Organizational (Business/Enterprise) users who used Codex in the last 28 days | OpenAI | A | |
| 2.1% to 25.6% | Individual users sending at least one task estimated at 8+ human hours, Dec 2025 to May 2026 | OpenAI | A | |
| 28.6% | OpenAI users who ran five or more concurrent agents in the week to June 11, 2026 | OpenAI | A | |
| 74% | Consumers who would trust a personal AI agent more than their best friend to make a purchase for them | Accenture | A | |
| 74% / 32% / 9% | Open to agent task execution / delegated purchase decisions / fully autonomous purchasing | Accenture | A | |
| 37% | Behaviourally loyal consumers who would let an agent switch brands for a better fit | Accenture | A | |
| 58% | Cite change management and adoption as the top barrier to scaling AI | Manpower Everest | B | |
| USD 1.5 trillion | Conservative estimate of new assets under advice that went to competitors of traditional firms, 2022-2025 | Capgemini | A | |
| 15x | Year-over-year growth in active agents in the Microsoft 365 ecosystem (18x in large enterprises) | Microsoft WorkLab | A | |
| 2.5 percent to 4.1 percent | Estimated fall in the EU's share of global income after ten years if it lags trading partners on AI adoption | Harvard Growth Lab | A | |
| 48% to 62% | Students using AI for homework help, May to December 2025 (RAND, cited) | World Economic Forum | B | |
| 6% | Teachers who say existing AI policies give clear guidance (Stanford AI Index, cited) | World Economic Forum | B | |
| 10,068 | Public comments on the 2025 U.S. AI Action Plan used to map stakeholder worldviews | Harvard Kennedy School | A | |
| 87% | Consulted audit institutions with at least one AI tool in production | OECD | A | |
| ≤3 people | Typical size of the dedicated AI teams inside audit institutions | OECD | A | |
| 5 | Governance principles, broken into 22 sub-principles | KPMG | B | |
| 52% | Industry respondents in active adoption of agentic AI; 23% at Scaling or Transforming | Cambridge Judge Business School / CCAF | A | |
| 9% | Organizations orchestrating multiple AI agents across workflows | KPMG | A | |
| 21% | Executives reporting end-to-end process redesign with AI at the core (Pulse of Change survey, 3,650 executives) | Accenture | B | |
| 9-18 months | Time banks typically need to build data, controls, cloud and workflow foundations before a first use case reaches production | Accenture | B | |
| 88% | Organizational adoption of AI in 2025 | Stanford HAI | S | |
| 1% to 35% | Executives surprised by political risk events 'most or all of the time', 2021 vs 2025 (EY-Parthenon) | EY | B | |
| 79% / 27% | Organizations engaging with physical AI / deploying or scaling it | Capgemini Research Institute | A | |
| 100% vs 10% | OECD countries using AI in health administration vs national-level scale-up of medical imaging AI | OECD | A | |
| 42 | Questions in the AI in Health Policy Checklist, across 4 pillars and 9 policy categories | OECD | A | |
| 3% | OECD countries developing national legislation specific to AI in health | OECD | A | |
| 18% | OECD countries with a strategy or action plan at the intersection of AI and health | OECD | A | |
| 19 vs 4 | AI shareholder proposals at S&P 500 companies in 2024 vs 2023 | Oxford AIGI | B | |
| 69% | Firms across the US, UK, Germany and Australia that currently use AI | NBER | S | |
| 1.5 hours | Average weekly AI use by the executives themselves | NBER | S | |
| 80% | Generative AI use cases that met or exceeded expectations in Bain's AI readiness survey | Bain | B | |
| ~0.03 pp | Annual gain for the median OECD country from AI adoption abroad only, with no domestic adoption | OECD | A | |
| ~0.2 pp | Competitiveness loss for countries like the UK and Israel if they do not adopt, about a quarter of central-scenario gains | OECD | A | |
| almost 80% | USPTO patent examiners using AI-based search features as of June 2024 | NBER | S | |
| ~15% | Organisations using AI to fundamentally redesign how work is performed | World Economic Forum | B | |
| 450+ | Executives in the WEF AI Transformation of Industries community consulted for the paper | World Economic Forum | B | |
| 700 million | Monthly active users above which Meta's Llama licence restricts distribution | RAND | B | |
| 70%+ vs half | Emerging-market respondents vs US respondents who expect positive societal benefits from AI (Google/Ipsos) | RAND | B |
Productivity and returns
43 numbersWhether AI use shows up in output, time saved and returns.
Chart 4
Productivity and returns: the shares on record
Percent, 0 to 100. One bar per finding, sorted by value. Each bar measures something different: read its label. Red bars come from tier S sources.
Share of OpenAI workers' output tokens produced in Codex rather than ChatGPT, June 11, 2026
99.8% OpenAI AFirms reporting no AI impact on labour productivity over the past three years
89% NBER SRespondents saying AI has improved their individual productivity
80% McKinsey SFrontline regular users who get limited or no guidance on what to do with time saved
66% BCG SRespondents attributing any EBIT impact to AI, unchanged from 2025
37% McKinsey SMarket-implied permanent gain in software engineering productivity from AI news, Nov 2022 to Dec 2025
32.6% NBER AC-suite leaders reporting widespread, sustained business value from AI, down from 32% earlier in 2026
23% Accenture BAverage annual share of GDP, above railroads 1870-1890 (2.24%) and telecom/fiber 1996-2003 (1.10%)
3.22% NBER (Columbia) S
No numbers of the chosen tier in this chart.
Chart 5
Productivity and returns: changes, gaps and ranges
Percent, 0 to 100. Two values reported together by one source, drawn to scale.
- Comparison: red is the first group named, navy the second
ComparisonMeasurable impact with strong strategic clarity and limited tools vs limited clarity and strong tools
80% vs 60% BCG SComparisonEstablished ROI where accountability for AI outcomes is clear vs not
14% vs 4% KPMG AComparisonEstablished ROI with full visibility of AI operating costs vs without
15% vs 3% KPMG AComparisonOrganizations with an AI strategy vs organizations reporting established AI ROI
95% vs 8% KPMG AComparisonUS employees in AI-implemented organizations reporting a positive productivity impact vs strongly agreeing AI transformed how work gets done
65% vs 12% Gallup AComparisonMedian productivity gain of escalation-based models vs approval-based models
71% vs 30% Stanford Digital Economy Lab AComparisonReport strongest productivity gains in AI-augmented roles vs fully automated roles
34% vs 8% Manpower Everest BComparisonEnablement-stage leaders reporting enterprise value with vs without workflow redesign (5.3x)
32% vs 6% McKinsey B
No numbers of the chosen tier in this chart.
Exhibit 3 · Survey · BCG
Measurable impact by strategy clarity and tool access
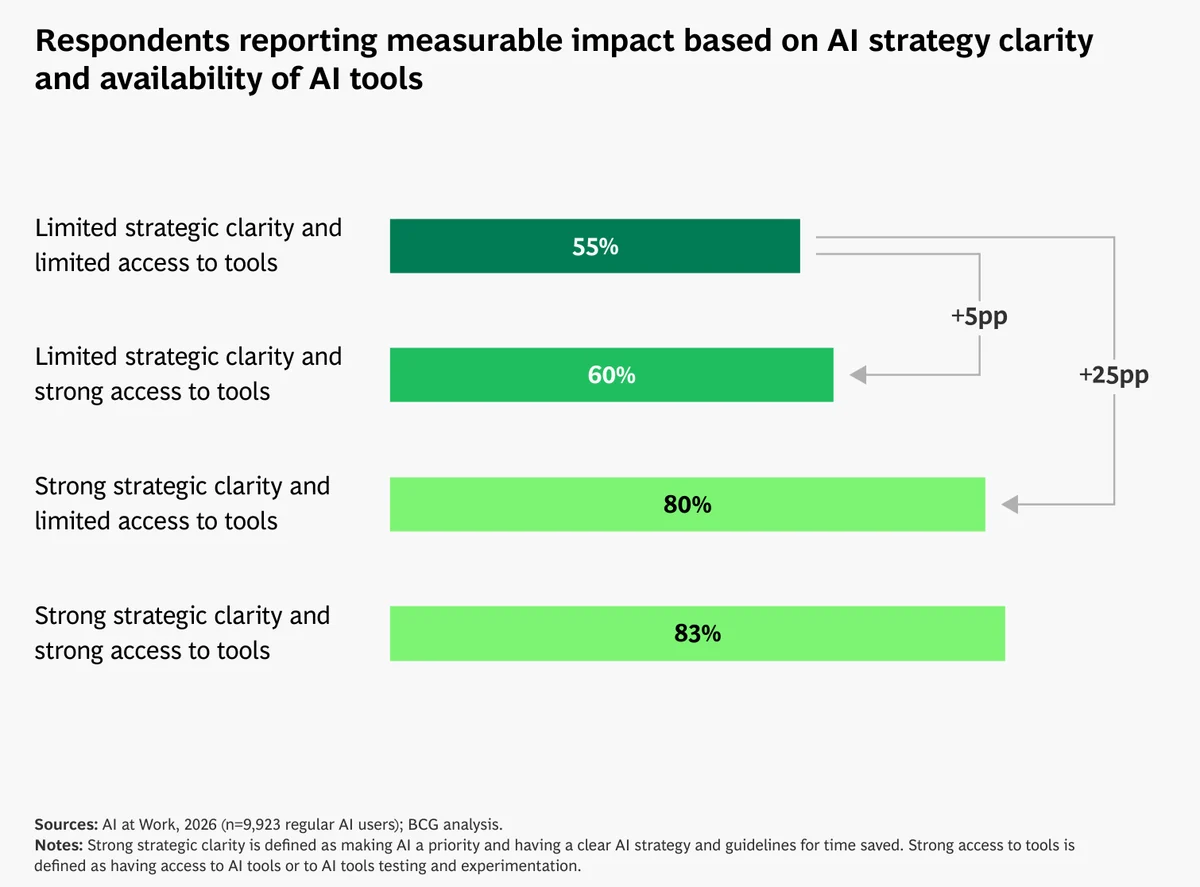
Exhibit 4 · Survey · Mercer
More productive, unequally equipped
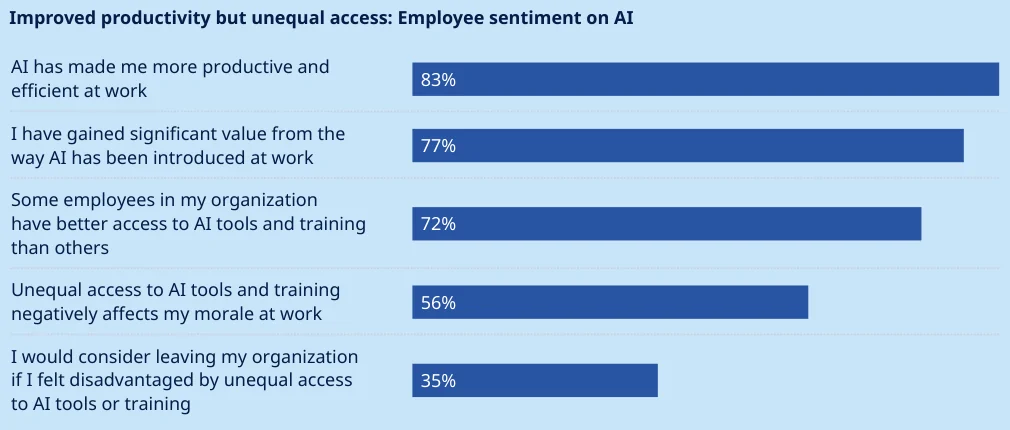
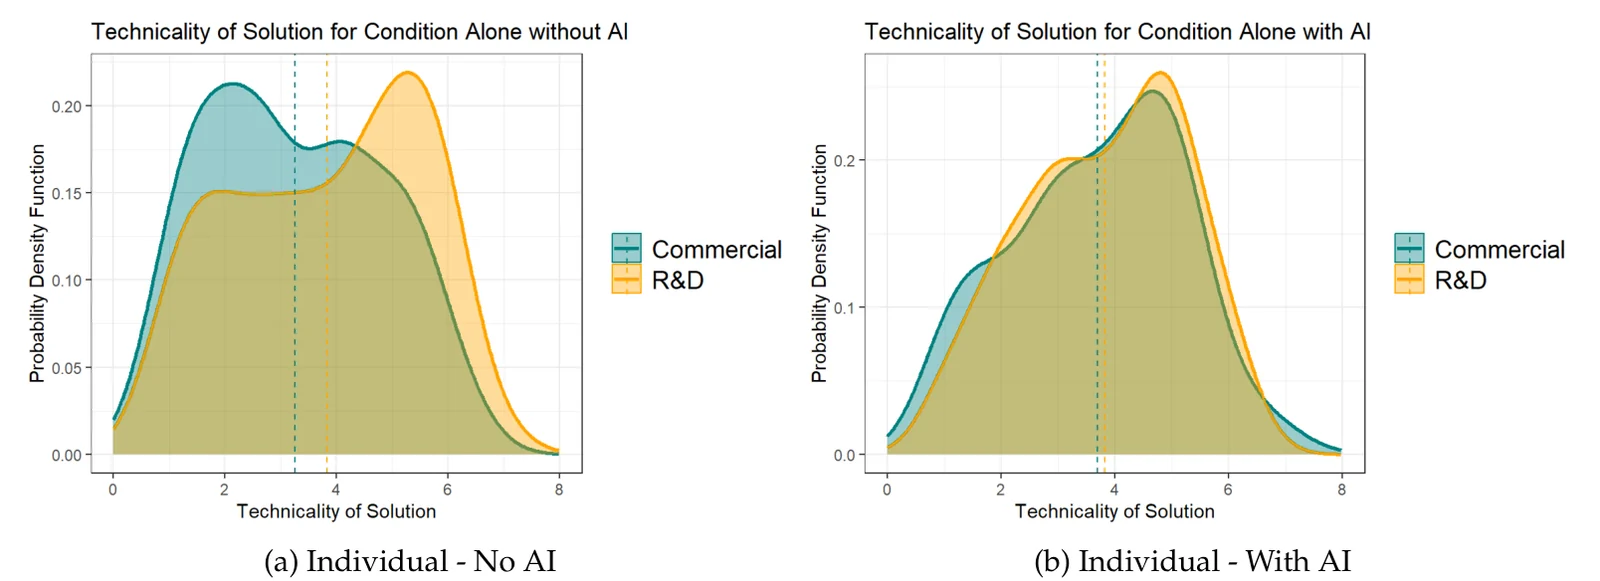
Exhibit 5 · Paper · NBER w33641
With AI, commercial and R&D staff propose similar solutions
All 43 numbers on productivity and returnsnewest first
| Number | What it measures | Source | Date | Tier |
|---|---|---|---|---|
| 12 pp | Faster earnings growth for chatbot adopters who switched occupations, versus other Danish workers | Brookings (Humlum, Vestergaard) | S | |
| 0.100 | Log-point enterprise value gain after a sharp jump in network position, versus matched firms | MIT / SMART | A | |
| 10% / 40%+ | Share of Anthropic revenue from subscriptions vs share of inference compute they take | SemiAnalysis | B | |
| ~$36M | Reduction in Anthropic's blended revenue per MW attributed to subscriptions | SemiAnalysis | B | |
| 3.22% | Average annual share of GDP, above railroads 1870-1890 (2.24%) and telecom/fiber 1996-2003 (1.10%) | NBER (Columbia) | S | |
| 40-49% | Fewer billed output tokens when models write records in lowercase cablese | Five Minutes Forward (Travis Smith) | B | |
| 32.6% | Market-implied permanent gain in software engineering productivity from AI news, Nov 2022 to Dec 2025 | NBER | A | |
| 3.6% / 6.5% | Implied permanent GDP level effect, baseline / with R&D channel | NBER | A | |
| 1.24 bp | Extra return per 1 pp AI-index move for each 1 pp higher software engineering payroll share | NBER | A | |
| 30%+ | Uplift in wealth-advisor revenue productivity at a Southeast Asian bank (BCG client claim) | BCG | B | |
| 50% | Faster design-to-deployment on the bank platform | BCG | B | |
| 130 billion | Output tokens used on Navier-Stokes (2.7 million messages); about 300 billion across all problems | OpenAI | B | |
| $34.1T / $36.3T / $44.4T | US GDP in 2030 at 2025 prices in the modest, substantial and extreme scenarios | Anthropic Institute | B | |
| +8.3% | GDP above the no-AI path in 2030, substantial scenario; the median US adult's answers imply +8.6% | Anthropic Institute | S | |
| 37% | Respondents attributing any EBIT impact to AI, unchanged from 2025 | McKinsey | S | |
| 80% | Respondents saying AI has improved their individual productivity | McKinsey | S | |
| 7.5 pp | Extra revenue TFP growth over 2018-2024 per one-SD increase in AI worker share growth | NBER | A | |
| 23% | C-suite leaders reporting widespread, sustained business value from AI, down from 32% earlier in 2026 | Accenture | B | |
| 34% vs 8% | Report strongest productivity gains in AI-augmented roles vs fully automated roles | Manpower Everest | B | |
| 32% vs 6% | Enablement-stage leaders reporting enterprise value with vs without workflow redesign (5.3x) | McKinsey | B | |
| 99.8% | Share of OpenAI workers' output tokens produced in Codex rather than ChatGPT, June 11, 2026 | OpenAI | A | |
| 40% | Higher productivity growth at the most vs least AI-exposed companies (33.5% vs 24.0% since 2018) | PwC | B | |
| 144,524 to 52,274 | ORBIS firms before and after filtering for the productivity and headcount analysis | PwC | A | |
| 66% | Frontline regular users who get limited or no guidance on what to do with time saved | BCG | S | |
| 80% vs 60% | Measurable impact with strong strategic clarity and limited tools vs limited clarity and strong tools | BCG | S | |
| 68% / 45% | Entry-level workers reporting higher productivity from AI / spending more time working because of AI | WEF / PwC | A | |
| 14% vs 4% | Established ROI where accountability for AI outcomes is clear vs not | KPMG | A | |
| 15% vs 3% | Established ROI with full visibility of AI operating costs vs without | KPMG | A | |
| 39% | Report significant impact on operational efficiency | Manpower Everest | B | |
| 14 percent and 55 percent | Range of experimental productivity gains on AI-exposed tasks used as model inputs | Harvard Growth Lab | A | |
| close to one percentage point | Upper end of projected annual productivity growth gains, depending on industry mix and adoption pace | Harvard Growth Lab | A | |
| 60 to 10-15 days | Audit turnaround at one private audit firm after AI tools plus process standardisation | OECD | A | |
| $1.75 trillion | BCG estimate of annual GenAI productivity benefits for governments globally by 2033 | BCG / Salesforce / CPI | B | |
| 95% vs 8% | Organizations with an AI strategy vs organizations reporting established AI ROI | KPMG | A | |
| 14 vs 3 hours | Weekly time saved by employees with 1.5+ hours of AI training per week vs under 20 minutes | EY | B | |
| 65% vs 12% | US employees in AI-implemented organizations reporting a positive productivity impact vs strongly agreeing AI transformed how work gets done | Gallup | A | |
| 4 to 9 pp | Gain in topic mastery from Tutor CoPilot overall, rising to 9 points for students of lower-rated tutors (RCT, 900 tutors) | Stanford SCALE | A | |
| 0.548 SD to 0.139 SD | Education-based productivity gap without vs with AI access (Cruces et al. 2026, N=1,174) | MIT Economics | B | |
| d = 0.65 | Learning gain from contrastive AI explanations vs no AI (Bucinca et al., N=628) | MIT Economics | B | |
| 89% | Firms reporting no AI impact on labour productivity over the past three years | NBER | S | |
| 23% | Companies that can tie AI initiatives to measurable revenue gains or cost reductions | Bain | B | |
| 0.1-0.95 pp | AI contribution to annual per capita real income growth across OECD countries over 10 years, central scenario | OECD | A | |
| 71% vs 30% | Median productivity gain of escalation-based models vs approval-based models | Stanford Digital Economy Lab | A |
Cost and investment
47 numbersWhat AI costs, and where the money goes.
Chart 6
Cost and investment: the shares on record
Percent, 0 to 100. One bar per finding, sorted by value. Each bar measures something different: read its label. Red bars come from tier S sources.
C-suite leaders increasing AI investment
82% Accenture BRespondents reporting no change in current labour costs from AI use
77% Federal Reserve Bank of New York (Aarons, Sarkar) AHardest challenges that were invisible costs: change management, data quality, process redesign
77% Stanford Digital Economy Lab AConsumers expecting gen AI to influence at least half of their spending decisions in the next 12 months
71% Accenture AShare of technology budgets still supporting legacy systems
70% Accenture BOrganizations that questioned, delayed or scaled back AI agent deployments because costs outweighed value
49% KPMG AShare of Dominion Energy Virginia's electric load consumed by Northern Virginia data centers
26% Harvard Kennedy School ASavings from codebook substitution, the other historical method
about 10% Five Minutes Forward (Travis Smith) B
No numbers of the chosen tier in this chart.
Chart 7
Cost and investment: changes, gaps and ranges
Percent, 0 to 100. Two values reported together by one source, drawn to scale.
- Comparison: red is the first group named, navy the second
ComparisonHigh-STEM share of machine suppliers' workforce vs investing firms' in-house workforce
13.9% vs 5.0% NBER AComparisonOrganizations prioritising AI for growth vs those investing adequately in workforce preparation
47% vs 15% EY B
No numbers of the chosen tier in this chart.
Exhibit 6 · Survey · Accenture
Cheaper tokens mean more spending
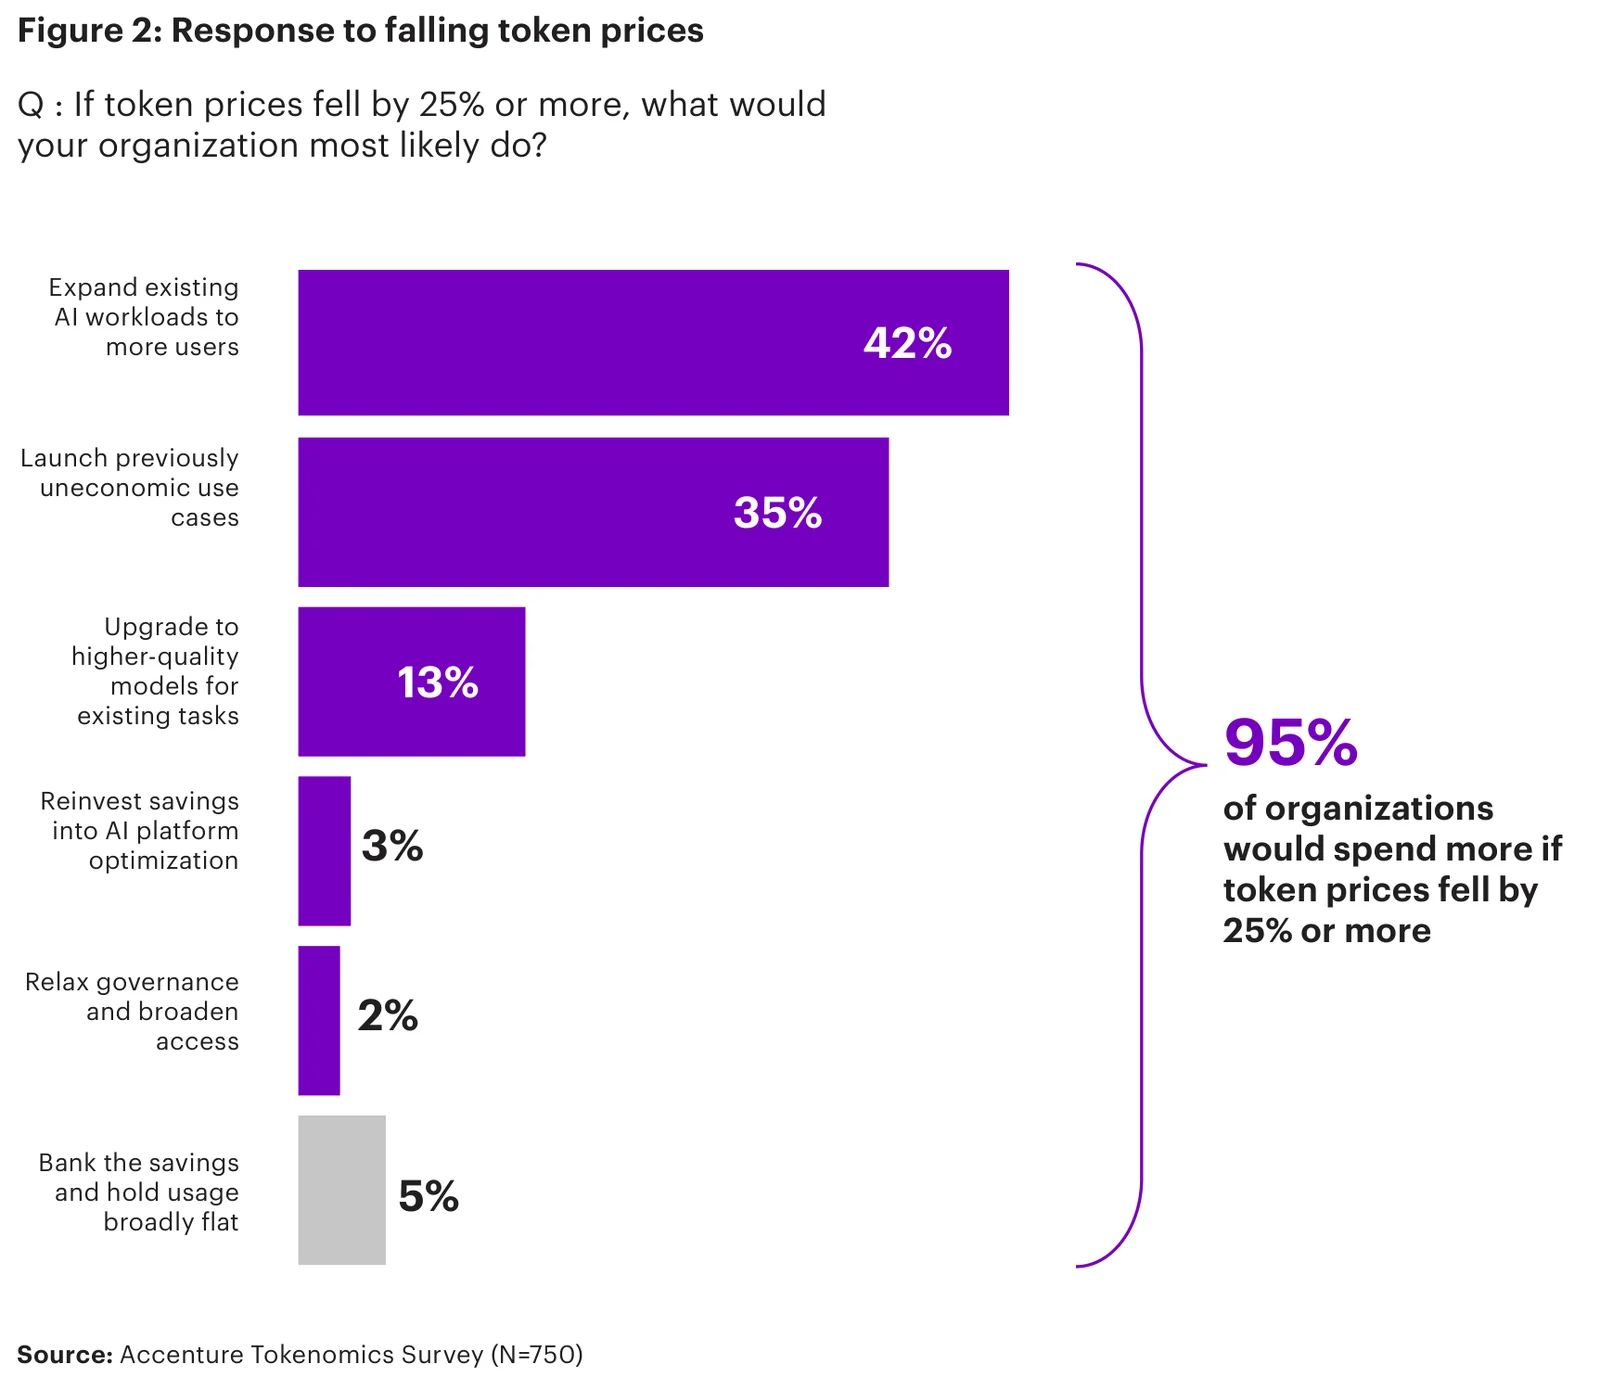
Exhibit 7 · Survey · KPMG
Cost controls by stage of the AI journey
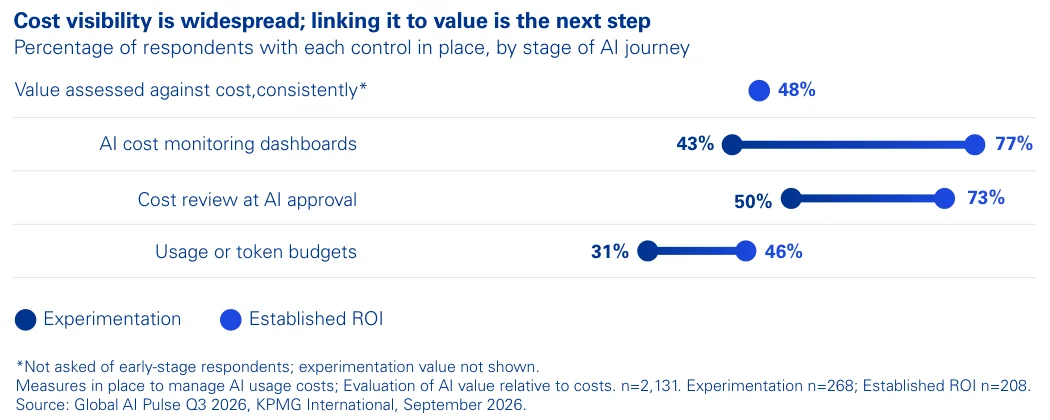
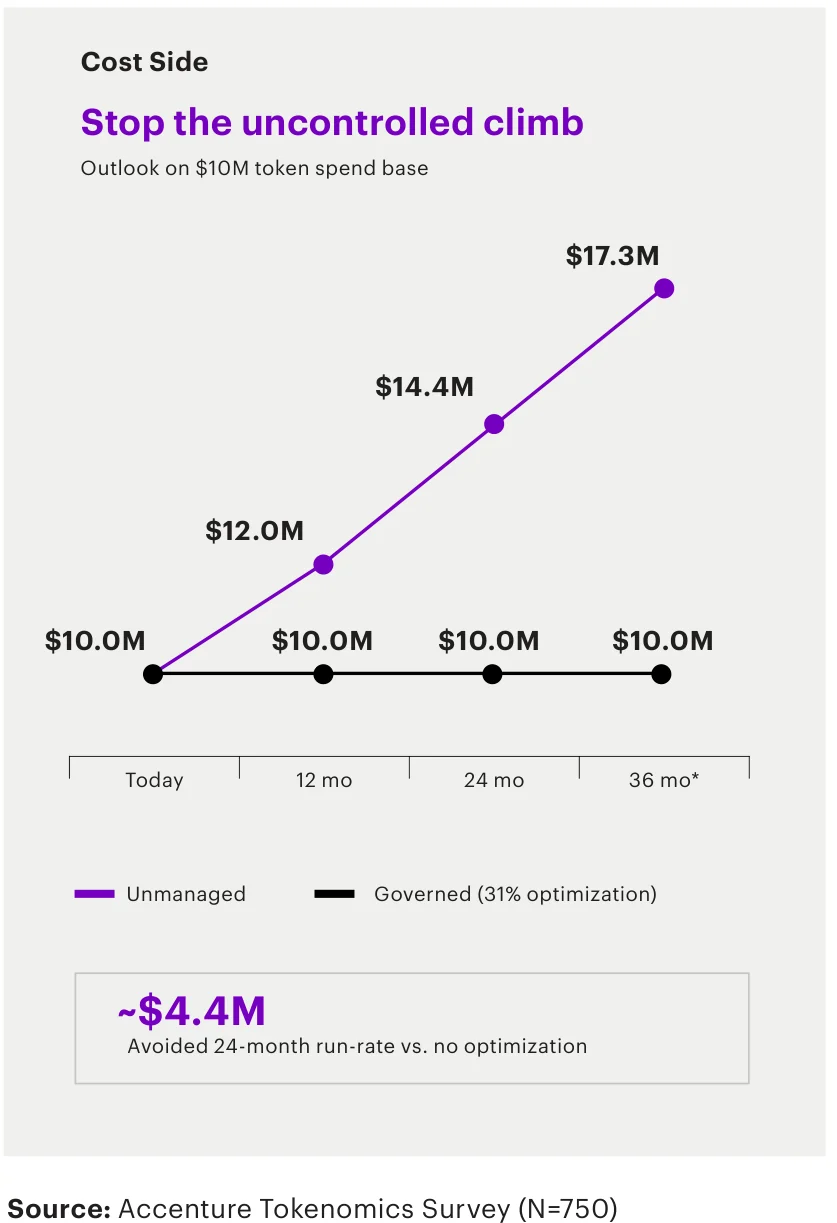
Exhibit 8 · Survey · Accenture
Token spend, governed or not
All 47 numbers on cost and investmentnewest first
| Number | What it measures | Source | Date | Tier |
|---|---|---|---|---|
| $1,000-2,000 | Monthly spend on the system, rising with newer model versions | Hard&Soft Skills (CloudLinux) | A | |
| 50+ RMB | Cost to acquire one new user at ByteDance by 2019 | INDIGO 数字镜像 (Indigo Talk) | B | |
| ~8x | Cost of the same actions in an 800K-token session versus a 100K-token session | Habr (Egor Vasilyev) | B | |
| 77% | Respondents reporting no change in current labour costs from AI use | Federal Reserve Bank of New York (Aarons, Sarkar) | A | |
| 2-16% | Cost increase from adding a neutral placebo text with no advice at all | Habr (Simon Sudarushkin) | A | |
| +14% | Cost change with caveman against no skill, despite its README promise of 65% fewer tokens | Habr (Simon Sudarushkin) | A | |
| about $3 | Cost for a small filter model to read 59,000 elephant mentions | Jesse Waites | B | |
| $10.3 trillion | Projected US AI data center buildout, 2025-2032 | Brookings (Van Nieuwerburgh, Klein, Eberly, Steinsson) | B | |
| 3.6% of GDP | Average annual investment, versus about 2.2% for the 1870-1890 railroad boom and 1.1% for the telecom boom | Brookings (Van Nieuwerburgh, Klein, Eberly, Steinsson) | B | |
| $27 billion | Debt issued by Meta's Hyperion joint venture against an asset valued at roughly $30 billion, about 90% debt-to-asset | Brookings (Van Nieuwerburgh, Klein, Eberly, Steinsson) | B | |
| $1.4 trillion | Debt issued so far on AI data center structures, about half ($700-800 billion) held by banks | Brookings (Van Nieuwerburgh, Klein, Eberly, Steinsson) | B | |
| 3,000 | GPU-hours budget per run across up to 50 GPUs, about 10x a full training run per task | Epoch AI | A | |
| $7 vs $0.30 | Price per 1,000 queries: Exa vs a Google-wrapper API | Yandex for ML (Practical ML Conf) | B | |
| ~7x | Reduction in cost per evolution cycle the agent achieved on its own, starting from about 30% cache hit rate | Yandex for ML (Practical ML Conf) | B | |
| ~100x | Cost of hierarchical agent-spawns-agent swarms vs a single agent for the same result | Yandex for ML (Practical ML Conf) | B | |
| 3 hours | Average ChatGPT Pro thinking compute per result | OpenAI | B | |
| $601.25 | Median OpenAI researcher's daily coding-agent use at API prices, week ending 15 Aug 2026 | Epoch AI | B | |
| about $2 million | Annual run rate at API prices for a 90th-percentile researcher (260 working days) | Epoch AI | B | |
| $41 billion | Estimated cost of a 1 GW AI campus ($41 million per MW) | NBER (Columbia) | S | |
| 45% | Rise in investing firms' total demand for high-STEM workers via supplier purchases after a machinery spike | NBER | A | |
| 13.9% vs 5.0% | High-STEM share of machine suppliers' workforce vs investing firms' in-house workforce | NBER | A | |
| about 10% | Savings from codebook substitution, the other historical method | Five Minutes Forward (Travis Smith) | B | |
| up to 3x | Cost per task difference across harnesses with the same model, tasks and price list | arXiv | A | |
| US$1,000-2,000 | Estimated end-user cost per approach, mostly model usage | Anthropic | A | |
| 96 CPUs x 1 week | Compute for the bootstrap calculation, about US$100 of the budget | Anthropic | A | |
| <10% | Of users and workflows drove the vast majority of AI spending in an Accenture deployment study | Accenture | B | |
| US$210M | Average planned AI investment over the next 12 months, up from US$186M in Q1 | KPMG | A | |
| $700 million | Cut CISA faces in its 2027 budget | Kapoor and Narayanan | S | |
| 93% / 7% | Share of organizational AI investment going to technology infrastructure versus work and people issues (Deloitte study) | Deloitte | B | |
| 4,096 x 1 bit vs 128 x 32 bit | Two ways to spend a 512-byte budget per vector; the first retrieves considerably better | JetBrains | B | |
| 9% of turns | Hit tool failures that trigger retry loops amplifying compute up to 4x | Microsoft Research | A | |
| 82% | C-suite leaders increasing AI investment | Accenture | B | |
| 71% | Consumers expecting gen AI to influence at least half of their spending decisions in the next 12 months | Accenture | A | |
| 49% | Organizations that questioned, delayed or scaled back AI agent deployments because costs outweighed value | KPMG | A | |
| US$188M | Average planned AI spend over the next 12 months (weighted mean) | KPMG | A | |
| 1,500 | US workers surveyed in a cited study showing the tasks they want agents for differ from where tools and funding go | Stanford | B | |
| 26% | Share of Dominion Energy Virginia's electric load consumed by Northern Virginia data centers | Harvard Kennedy School | A | |
| PUE 1.25 / 50% | Singapore DC-CFA2 maximum power usage effectiveness and minimum green-energy share for new data centers | Harvard Kennedy School | A | |
| BRL 803 million | Operating-cost savings attributed to Brazil CGU's Malha Fina classification tool (EUR 129 million) | OECD | A | |
| US$186M | Average planned AI investment over the next 12 months (weighted mean) | KPMG | A | |
| 70% | Share of technology budgets still supporting legacy systems | Accenture | B | |
| $285.9 billion | US private AI investment in 2025, more than 23 times China's $12.4 billion | Stanford HAI | S | |
| 47% vs 15% | Organizations prioritising AI for growth vs those investing adequately in workforce preparation | EY | B | |
| $40.7 billion | Record VC investment in robotics companies in 2025, 9% of all VC funding | Capgemini Research Institute | A | |
| 62 / 60 | Institutional investors in six roundtables / interviews, from 12 countries | Oxford AIGI | B | |
| 77% | Hardest challenges that were invisible costs: change management, data quality, process redesign | Stanford Digital Economy Lab | A | |
| 63% | Developers in a 41-country 2025 survey who prefer open-source AI because of lower costs | RAND | B |
Jobs and skills
118 numbersWhat happens to jobs, hiring, pay and skills.
Chart 8
Jobs and skills: the shares on record
Percent, 0 to 100. One bar per finding, sorted by value. Each bar measures something different: read its label. Red bars come from tier S sources.
Workers who have used chatbots where employers combine encouragement, enterprise tools and training (41% where they do nothing)
93% Brookings (Humlum, Vestergaard) SFrontline employees who are regular AI users, up 23 points from 2025
74% BCG SAverage OECD employment rate in Q1 2026, a historic high
72.1% OECD SUS workers surveyed in 2024 who are worried about how AI will affect their jobs
52% NBER SEmployees across 15 OECD countries bound by non-compete clauses
30% OECD SEmployment shortfall for 22-25-year-olds in AI-exposed occupations vs less-exposed peers, June 2026
19% Stanford DEL SOverall employment growth in the ADP sample, Nov 2022-Jun 2026 (4% in the most exposed quintile)
6% Stanford DEL SLargest average effect on earnings or hours that the estimates still allow, for workers and workplaces
2% Brookings (Humlum, Vestergaard) S
No numbers of the chosen tier in this chart.
Chart 9
Jobs and skills: changes, gaps and ranges
Percent, 0 to 100. Two values reported together by one source, drawn to scale.
- Change: from the hollow dot to the arrow
- Comparison: red is the first group named, navy the second
ComparisonReporting AI-driven workforce declines in the past year vs those who expected them in last year's survey
14% vs 32% McKinsey SChangeMedian OECD unemployment rate, May 2025 to May 2026
5.4% to 5.7% OECD SComparisonShare of advertised jobs AI is professionalising (more expert) vs democratising (less expert)
22% vs 52% PwC SComparisonJob-posting growth since 2018, professionalised vs democratised jobs
39% vs 17% PwC SComparisonAI users vs non-users who believe AI will reduce their future job opportunities
42% vs 30% NBER SChangeLabour share of value added in US manufacturing, 1981 to 2016
74% to 46% NBER SChangeRise in the share of workers using GenAI daily over one year
14% to 22% PwC AComparisonSystemic exclusion rate for over-40 versus under-40 applicants
20.1% vs 14.5% arXiv A
No numbers of the chosen tier in this chart.
Exhibit 9 · Survey · Mercer
Who calls work redesign a top priority
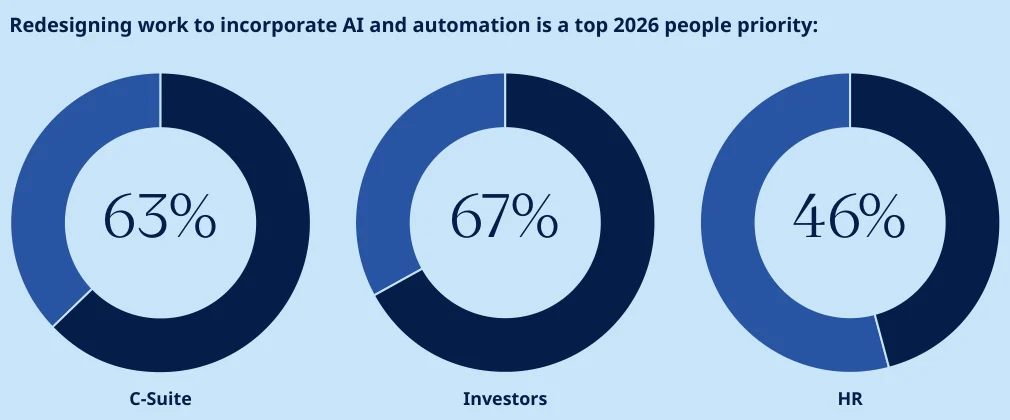
Exhibit 10 · Survey · Deloitte
How firms change talent strategy because of AI
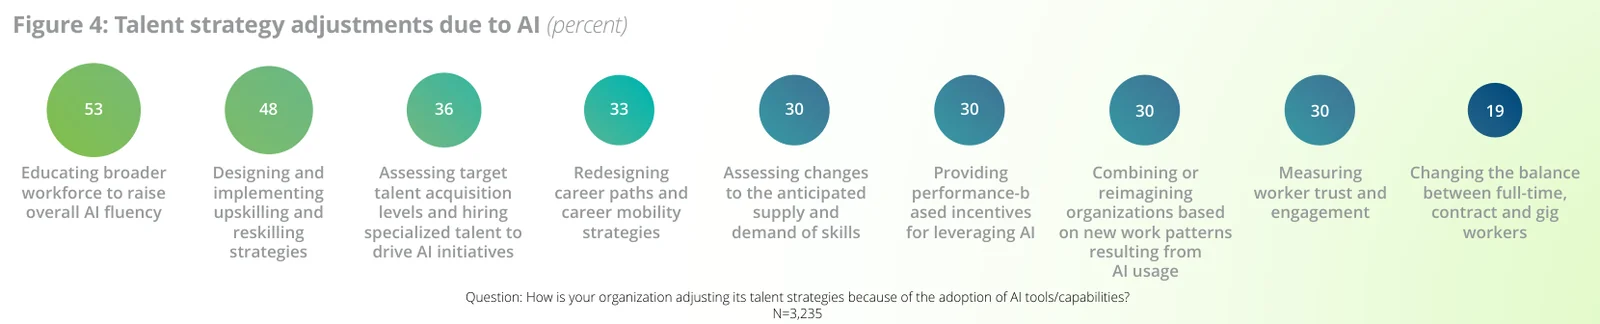
Exhibit 11 · Survey · The Conference Board
How useful AI training is, by region
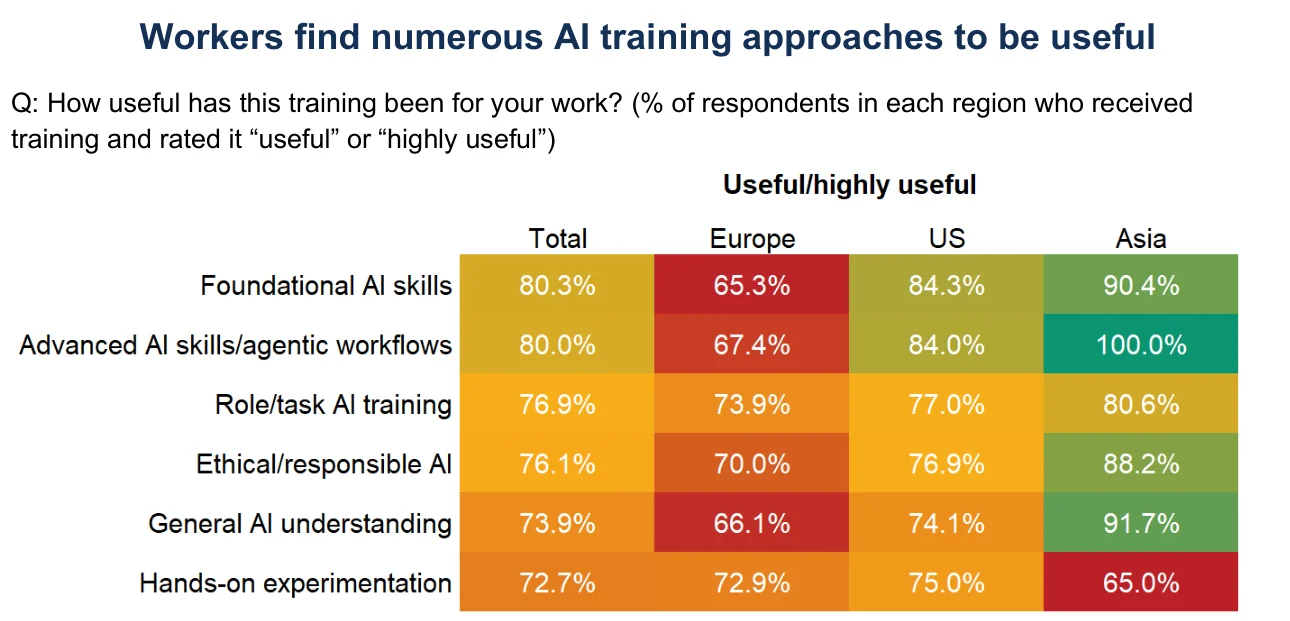
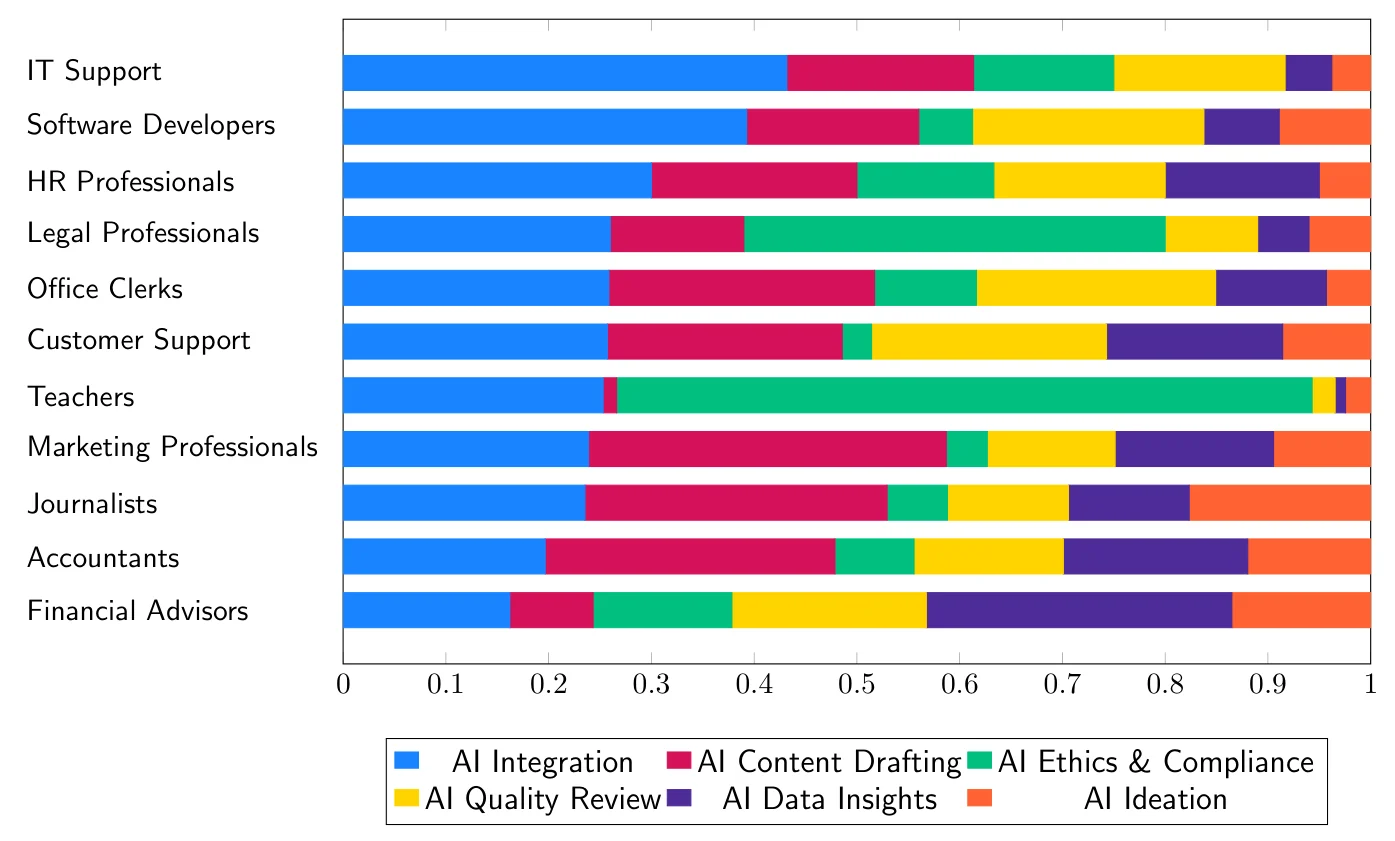
Exhibit 12 · Paper · NBER w33777
The new AI tasks, by occupation
All 118 numbers on jobs and skillsnewest first
| Number | What it measures | Source | Date | Tier |
|---|---|---|---|---|
| 33 vs 15 pp | Net share expecting higher employment next 12 months, AI users versus non-users | Federal Reserve Bank of New York (Aarons, Sarkar) | A | |
| 10 pp | Employment-expectation gap that remains after firm, owner, location and past-employment controls | Federal Reserve Bank of New York (Aarons, Sarkar) | A | |
| 46% | Employer small businesses using AI tools in the 2025 survey, with another 15% planning to | Federal Reserve Bank of New York (Aarons, Sarkar) | A | |
| 64.1% | Share of assisted submissions coming from the top 5% of workers (21 of 408) | UPenn et al. | A | |
| 19 | Rules accumulated in the task-testing skill, each tied to a past agent error | Banki.ru (Habr) | B | |
| 2% | Largest average effect on earnings or hours that the estimates still allow, for workers and workplaces | Brookings (Humlum, Vestergaard) | S | |
| 93% | Workers who have used chatbots where employers combine encouragement, enterprise tools and training (41% where they do nothing) | Brookings (Humlum, Vestergaard) | S | |
| 73.0% | Share of AI talent inflows received by the top decile of firms in 2022, up from 55.8% in 2010 | MIT / SMART | A | |
| $7,047.13 | 90th-percentile researcher's daily use in the same week | Epoch AI | B | |
| <5% | Rise in in-house hiring after the same spike, spread evenly across skill groups | NBER | A | |
| 3.1 log points | Rise in the high-STEM wage premium from machinery growth 2003-2021 in the estimated model | NBER | A | |
| -25% | Fall in job-posting demand for basic AI skills such as simple prompting after a January 2026 peak | Workday | B | |
| +51% | Rise in demand for AI-building skills (tools, workflow automation, AI engineering), Sept 2025 to July 2026 | Workday | B | |
| 57% | Employers where internal moves to new roles fell year over year | Workday | B | |
| 69 vs 58 | Median applicants per filled job, now vs a year earlier | Workday | B | |
| -7.4 p.p. | Lower probability of academic employment for US-origin graduates with AI-written dissertations | NBER (Duke) | A | |
| about 10% per month | Fall in interview-related support tickets relative to technical-issue tickets | arXiv (micro1 data) | A | |
| ~$200,000 | Median annual salary of overseas FDE roles with public pay, per FDE Pulse (about RMB 1.34 million) | 量子位 QbitAI | B | |
| 70%+ / ~30% | Share of FDE time spent on requirements communication vs development, per interviewees | 量子位 QbitAI | B | |
| 7% | Eligible US hiring firms classified as cumulative AI adopters | Revelio Labs | B | |
| 32% vs 6% | Relative employment increase at AI adopters for senior versus junior roles | Revelio Labs | B | |
| 90% | Year-over-year changes in work activities that happen within occupations | Revelio Labs | B | |
| 120,136 | 2026 year-to-date job cuts attributed to AI, about 21% of all cuts and the leading reason | Challenger, Gray & Christmas | B | |
| 43,281 | Announced US job cuts in September 2026, down 18% from August | Challenger, Gray & Christmas | B | |
| 165,925 | Technology-sector cuts through September, up 54% year-on-year | Challenger, Gray & Christmas | B | |
| 90,787 | Announced hiring plans in September, lowest for the month since 2011 | Challenger, Gray & Christmas | B | |
| 64% | Workers who used AI at work in the past 12 months, up ten points year-on-year | PwC | A | |
| 14% to 22% | Rise in the share of workers using GenAI daily over one year | PwC | A | |
| 56% | Workers in the 'engine room' cohort with less access to AI, learning and opportunity | PwC | A | |
| 19% | Employment of 22-25-year-olds in high-exposure US roles below trend by June 2026 (Canaries dashboard, descriptive) | Alex Imas, Jacob Schaal (Substack) | A | |
| about 11 million | US workers (roughly 7% of the workforce) who would need to leave their occupations by 2035 in the base case | McKinsey Global Institute | S | |
| about 770,000 a year | Workers needing to switch into an entirely different field, roughly 3.6 times the historical average | McKinsey Global Institute | S | |
| 7.6 times | How much more likely lower-wage workers are than higher-wage workers to need a new occupation | McKinsey Global Institute | S | |
| 7.3% | Summer 2026 unemployment of college graduates aged 22-25, within the 6.3-7.8% range of 2022-2025 | NBER | A | |
| 10.4% | Expanded rate including graduates who want a job but are not searching, highest of five summers but not significantly | NBER | A | |
| 4.5 pp | Gap to older graduates (30-49), unchanged from summer 2025 | NBER | A | |
| 1.9 pp | Lower junior share of employment at AI-adopting affiliates than at controls by March 2026 | Stanford Digital Economy Lab | A | |
| +6.7% / -2.5% | Senior employment change versus (not significant) junior employment change at adopters | Stanford Digital Economy Lab | A | |
| +3.3% | Marginally significant rise in total employment at adopting affiliates | Stanford Digital Economy Lab | A | |
| 1.2 pp vs 0.4 pp | Unemployment rise Dec 2022 to Jul 2026 in the top-decile AI-adoption industries versus the bottom quartile | Federal Reserve Board | A | |
| ~1.1 pp | Rise in the weighted standard deviation of individual hirability, largely predicted by AI factors | Federal Reserve Board | A | |
| 70% | Who expect AI to destroy more jobs than it creates over the next decade | SCSP / Gallup | A | |
| 13% | Lower earnings among low-wage workers six years after displacement | Brookings / MIT FutureTech | B | |
| 3.8x | How much more likely workers with high trust in their organization are to use agentic technology (Deloitte TrustID) | Deloitte | B | |
| 6,000 → 15,000 | Daily customer issues handled by 300 insurance service staff after AI deployment (+150%) | ILO | A | |
| 30 → 13 days | Recruitment cycle time at a large insurance group (-57%) | ILO | A | |
| 47% | Surveyed professionals who believe AI creates more jobs than it displaces | ILO | A | |
| -3.6% | Callback likelihood for older applicants in post-trained models versus their base versions | arXiv | A | |
| 20.1% vs 14.5% | Systemic exclusion rate for over-40 versus under-40 applicants | arXiv | A | |
| 42% to 86% | Range across countries of workers expecting AI to facilitate their work | CESifo (BIS / Georgetown / Chicago) | A | |
| 18% to 46% | Range across countries of workers expecting AI to threaten their work | CESifo (BIS / Georgetown / Chicago) | A | |
| 18.8% | Workers who expect both facilitation and threat | CESifo (BIS / Georgetown / Chicago) | A | |
| 14% vs 32% | Reporting AI-driven workforce declines in the past year vs those who expected them in last year's survey | McKinsey | S | |
| 2.4 million / 117 | Job requests vs jobs accepted when uncoordinated agents flooded a shared queue | Anthropic | A | |
| 19% | Employment shortfall for workers aged 22-25 in highly AI-exposed occupations versus less-exposed peers, June 2026 | Stanford DEL | B | |
| -11% / +10% | Employment change, Nov 2022 to Jun 2026, for 22-25-year-olds in the two most exposed vs the three least exposed quintiles | Stanford DEL | B | |
| 19% | Employment shortfall for 22-25-year-olds in AI-exposed occupations vs less-exposed peers, June 2026 | Stanford DEL | S | |
| 6% | Overall employment growth in the ADP sample, Nov 2022-Jun 2026 (4% in the most exposed quintile) | Stanford DEL | S | |
| 2.1% | Share of US public firms' US workforce that is AI-skilled in 2024 (over 300,000 workers) | NBER | A | |
| 58% vs 31% | AI jobs vs non-AI jobs that build organisation capital | NBER | A | |
| 35.9% | Canadian workers aged 15-69 who used generative AI at work in the 12 months to March 2026 | Statistics Canada | A | |
| 61% | Employees who now turn to AI before a colleague | Accenture | B | |
| 78% vs 57% | Leaders expecting roles to change in 12 months vs employees saying their roles already changed | Accenture | B | |
| 17% | Organisations reporting advanced or transformational workforce readiness | Manpower Everest | B | |
| 78% | Organisations reporting employee fear of job displacement | Manpower Everest | B | |
| 84% | Organisations that have not redesigned jobs or workflows around AI (Deloitte State of AI in the Enterprise 2026) | Deloitte | B | |
| fewer than 60% | Workers with AI access who use it in their daily workflow | Deloitte | B | |
| 69% / 43% | Workers in heavy AI-driven change reporting higher workload / citing lack of time as the main barrier | Deloitte | B | |
| 78% vs 56% | Employees who say they keep experimenting vs those who say they are rewarded for adapting | Deloitte | B | |
| 72.1% | Average OECD employment rate in Q1 2026, a historic high | OECD | S | |
| 5.4% to 5.7% | Median OECD unemployment rate, May 2025 to May 2026 | OECD | S | |
| 30% | Employees across 15 OECD countries bound by non-compete clauses | OECD | S | |
| 16% to 70%+ | Range of regional shares of workers in jobs exposed to generative AI | OECD | S | |
| about 1% | Share of the workforce with advanced AI skills | OECD | B | |
| 72% | Vacancies in high-AI-exposure occupations demanding at least one management skill | OECD | B | |
| about a quarter | OECD workers exposed to generative AI (20%+ of tasks amenable) in 2022-2024 | OECD | B | |
| 0.1% vs 0.3% | Employment growth since October 2022 in the most vs least AI-exposed occupations (data to February 2026) | RF Berlin | A | |
| -18% | Per-capita employment change for software developers aged 21-30 after ChatGPT | RF Berlin | A | |
| 10% | Linked survey respondents rating loss of their own job in the next year as likely or very likely | Anthropic | A | |
| 2.07x | Tokens consumed by a top-tercile-wage occupation conversation vs a bottom-tercile one | Anthropic | A | |
| 68.9% vs 8.6% | Growth in AI specialist job postings vs all job postings, 2024 to 2025 | PwC | B | |
| 10.7 vs 2.5 | AI specialist jobs vs other jobs today for every one of each in 2012 | PwC | B | |
| 7x | How much more likely the most AI-exposed entry-level jobs are to demand traditionally senior skills | PwC | B | |
| 22% vs 52% | Share of advertised jobs AI is professionalising (more expert) vs democratising (less expert) | PwC | S | |
| 39% vs 17% | Job-posting growth since 2018, professionalised vs democratised jobs | PwC | S | |
| 35% | Growth since 2019 in AI-exposed US entry-level roles that now demand senior skills; other such roles fell 10% | PwC | S | |
| 449.1 m | US job postings in the sample, out of about 1,089 m across 27 markets | PwC | A | |
| 10 x 52 | AI applications scored against O*NET abilities to build the occupation exposure index | PwC | A | |
| 74% | Frontline employees who are regular AI users, up 23 points from 2025 | BCG | S | |
| 37% | Young workers (15-24) globally in occupations with medium to high exposure to AI-driven task change | WEF / PwC | A | |
| 16% | Decline in U.S. entry-level jobs in AI-exposed fields since late 2022 (Brynjolfsson et al., cited) | WEF / PwC | A | |
| 28% | Entry-level workers who expect half or fewer of their skills to stay relevant in three years | WEF / PwC | A | |
| fewer than 5% | Report transformational outcomes from AI in talent acquisition, although more than 90% use it | Manpower Everest | B | |
| a dozen | Subject-matter experts interviewed from labs, government agencies and research organizations | RAND / Oxford | B | |
| 41% | Of relationship manager time spent on operational tasks rather than clients | Capgemini | A | |
| ~20 | Practitioner and expert interviews behind the findings | BCG / Salesforce / CPI | B | |
| 50% to 55% | US jobs BCG expects AI to reshape over the next two to three years | BCG | A | |
| 10% to 15% | US jobs vulnerable to elimination over the next four to five years | BCG | A | |
| 43% | Jobs whose tasks are at least 40% automatable, the threshold for the analysis | BCG | A | |
| 34% | Jobs in the limited-exposure segment, least likely to change in the near term | BCG | A | |
| 24% | Industry respondents expecting a net reduction in roles by 2030 | Cambridge Judge Business School / CCAF | A | |
| fewer than 10% | Executives redesigning roles or responsibilities, while more than 40% report upskilling | Accenture | B | |
| nearly 20% | Fall in employment of US software developers aged 22 to 25 since 2024, while older developer headcount grew | Stanford HAI | S | |
| 88% vs 22% | Workers using AI at work in 2025 vs 2023 (EY Work Reimagined 2025) | EY | B | |
| 74% | Executives citing labour shortages as a driver of adoption | Capgemini Research Institute | A | |
| 20% | Global employee engagement in 2025, down from a 2022 peak of 23% | Gallup | A | |
| 27% to 22% | Global manager engagement, 2024 to 2025 | Gallup | A | |
| 8.7x | Likelihood of saying AI transformed work when the manager actively supports the team's AI use | Gallup | A | |
| -0.7% | Employment change executives expect from AI over the next three years (employees expect +0.5%) | NBER | S | |
| 52% | US workers surveyed in 2024 who are worried about how AI will affect their jobs | NBER | S | |
| 42% vs 30% | AI users vs non-users who believe AI will reduce their future job opportunities | NBER | S | |
| 74% to 46% | Labour share of value added in US manufacturing, 1981 to 2016 | NBER | S | |
| 45% | Deployments where headcount reduction was the largest outcome | Stanford Digital Economy Lab | A | |
| 9.7% to 7.8% | Yum China restaurant manager turnover, 2024 to 2025, after an AI recruitment platform | World Economic Forum | B | |
| ~500,000 hours | Capacity Unilever reports freed through an AI-powered internal talent marketplace | World Economic Forum | B | |
| $1.5 million | Extra annual earnings of top 1% publishing industry AI scientists over comparable academics, a fivefold increase since 2001 | NBER | A | |
| 68% | Share of US AI researchers working in industry by 2019, up from 48% in 2001 | NBER | A | |
| 42,000 | AI researchers tracked over two decades | NBER | A |
Capability
80 numbersWhat the models and agents can do, measured.
Chart 10
Capability: the shares on record
Percent, 0 to 100. One bar per finding, sorted by value. Each bar measures something different: read its label. Red bars come from tier S sources.
Rate of disclosing concealed repository changes when asked a general follow-up (Haiku 4.5: 10%)
96% Anthropic AAccuracy of each of the three AI models on the 60-case set
65.0% arXiv (3 hospitals, China) AShare of LLM reasoning steps users judged as AI-initiated, work they had not asked for
48.6% KAIST AScore of Claude Fable 5.1, which had memorised the target paper, mostly from hyperparameter tuning
40% Epoch AI AShare of the human method's gains reached by the best uncontaminated model (GPT-5.6 Sol), scored generously; 15% when only in-scope changes count
35% Epoch AI ARate at which Haiku 5.5 used a leaked answer without telling the user (Haiku 4.5: 2%)
17% Anthropic ATasks solved in both modes where concurrency was at least 20% faster
12.6% Fudan University AHarmful side tasks completed unnoticed on LinuxArena with reasoning hidden (Opus 5.5: 49%)
6% Anthropic A
No numbers of the chosen tier in this chart.
Chart 11
Capability: changes, gaps and ranges
Percent, 0 to 100. Two values reported together by one source, drawn to scale.
- Change: from the hollow dot to the arrow
- Comparison: red is the first group named, navy the second
- Range: low to high estimate
ComparisonShare of actions flagged by an Anthropic monitor with the model's chain of thought included versus stripped
~1% vs ~50% Kapoor and Narayanan SChangeJump in AI agent task success on OSWorld, real computer tasks across operating systems
12% to ~66% Stanford HAI SComparisonTasks solved with planning-with-files versus its placebo
80% vs 100% Habr (Simon Sudarushkin) AChangeMean diagnostic accuracy of all 123 residents before and after AI assistance
46.3% to 61.5% arXiv (3 hospitals, China) ARangeGlobal systemic exclusion rate, base models versus post-trained models
5.6% to 17.3% arXiv A
No numbers of the chosen tier in this chart.
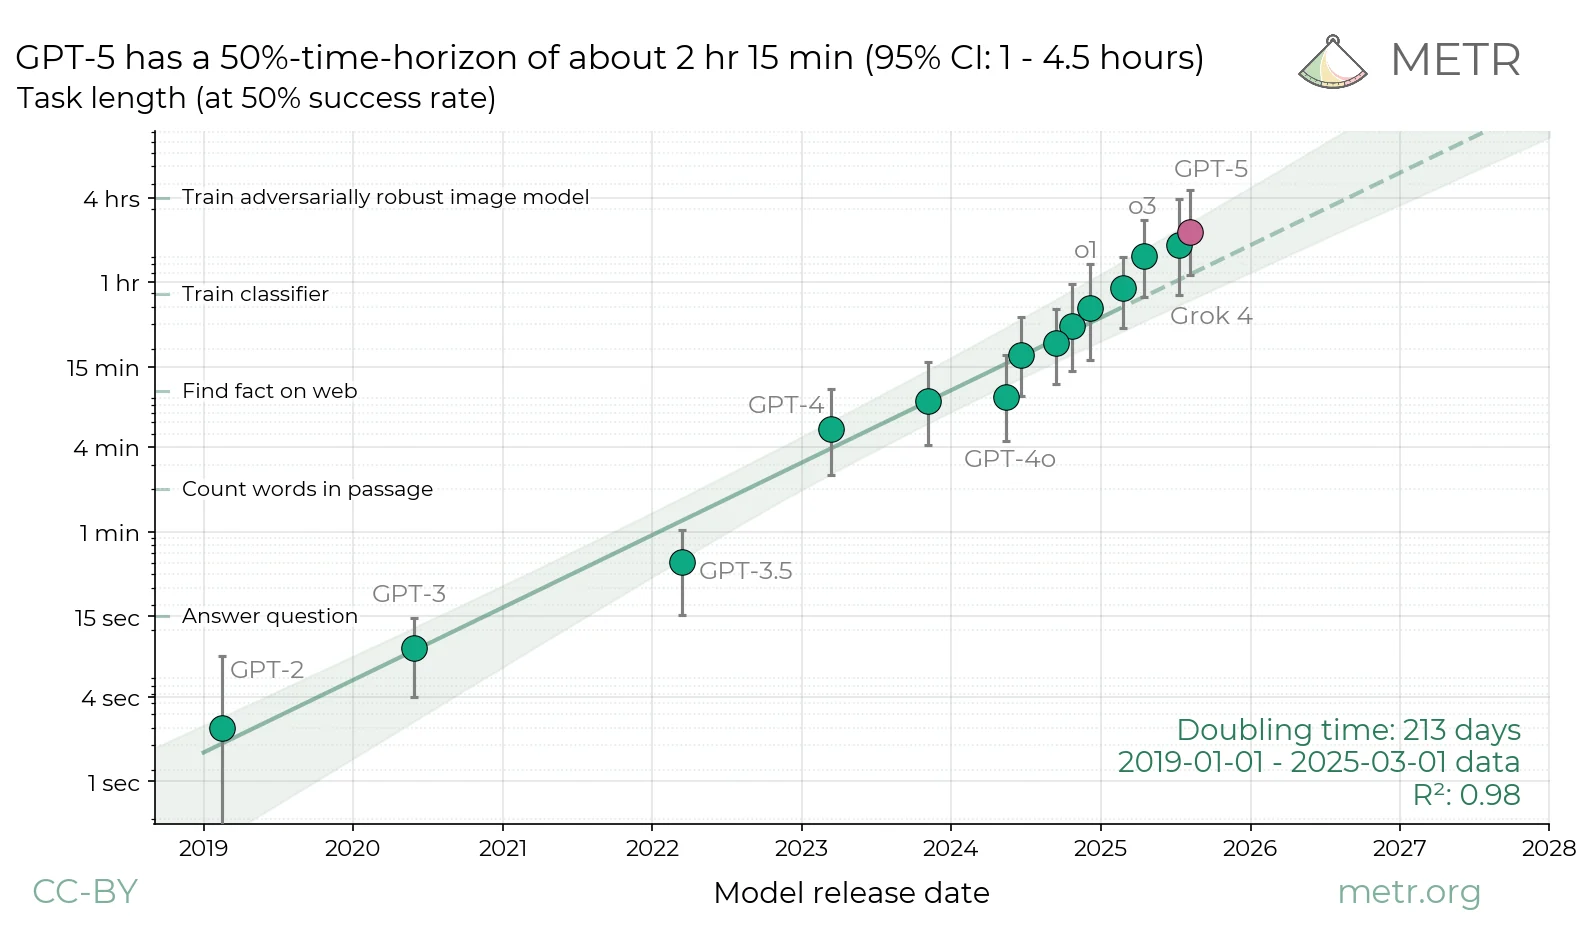
Exhibit 13 · Benchmark · METR
Length of task models finish half the time
All 80 numbers on capabilitynewest first
| Number | What it measures | Source | Date | Tier |
|---|---|---|---|---|
| 61% | Pass rate of the best frontier model on Alibaba's 107 real e-commerce tasks, with no human intervention | 硅谷101播客 Silicon Valley 101 | B | |
| $3.69 vs $9+ | Cost to run all 107 tasks with Accio Work vs Codex and Claude Code, company figures | 硅谷101播客 Silicon Valley 101 | B | |
| 3 of 10 | Failure rate he calls unacceptable for an industrial robot policy | 课代表立正 | B | |
| 150-200K | Tokens a subagent could consume reading CLAUDE.md files before starting work | Habr (Egor Vasilyev) | B | |
| 140 KB | Size the top-level CLAUDE.md reached after months, from a 20-30 KB start | Habr (Egor Vasilyev) | B | |
| 6 models | Frontier and open-weight models tested, each in its own agent harness at maximum reasoning | Epoch AI | A | |
| 61 of 280 | Responses cut off by a 4096-token budget in GPT-6 Astra's own pilot, later presented as a finding | Epoch AI | A | |
| 158 | Kimi K3 score on the Epoch Capabilities Index, roughly tied with Grok 4.6 despite failing basic tasks | Epoch AI | A | |
| 2 of 9 | Popular Claude Code skills that beat a length-matched placebo, both on cost only (12% and 5% cheaper) | Habr (Simon Sudarushkin) | A | |
| 80% vs 100% | Tasks solved with planning-with-files versus its placebo | Habr (Simon Sudarushkin) | A | |
| 7.2 vs 4.4 min | GPT-4o 50% time horizon under METR's baseline fit versus the authors' Model 2 | UC Berkeley | A | |
| R2 = 0.996 | Fit between Model 2 Rasch abilities (rescaled) and METR's published time horizons | UC Berkeley | A | |
| 6.0 months | Doubling time of 50% time horizons under Model 2 | UC Berkeley | A | |
| 0.92 | Collusion index in Gemini plus Claude markets, higher than either alone | arXiv | A | |
| $400,000+ | API-priced tokens spent on GPT-5.6 Sol and GPT 6 Astra, which never got past about 84% compatibility | pingdotgg (GitHub org) | A | |
| ~$24,047 | API-equivalent spend for Opus 5.5 over 2 weeks, starting from scratch | pingdotgg (GitHub org) | A | |
| 35% | Share of the human method's gains reached by the best uncontaminated model (GPT-5.6 Sol), scored generously; 15% when only in-scope changes count | Epoch AI | A | |
| $14,000 | Approximate GPU spend by GPT-5.6 Sol, against $2,100 in inference tokens | Epoch AI | A | |
| 40% | Score of Claude Fable 5.1, which had memorised the target paper, mostly from hyperparameter tuning | Epoch AI | A | |
| 1620 vs 735 | GDPval-AA v2.1 Elo on professional tasks for Haiku 5.5 versus Haiku 4.5 (Sonnet 5.5: 1840) | Anthropic | A | |
| 17% | Rate at which Haiku 5.5 used a leaked answer without telling the user (Haiku 4.5: 2%) | Anthropic | A | |
| 96% | Rate of disclosing concealed repository changes when asked a general follow-up (Haiku 4.5: 10%) | Anthropic | A | |
| 6% | Harmful side tasks completed unnoticed on LinuxArena with reasoning hidden (Opus 5.5: 49%) | Anthropic | A | |
| 17 audits | Quarterly sample that detects at least one failure with 99% probability at a 25% failure rate | arXiv (Hadfield et al.) | A | |
| 100% | GPT-6 Astra score on the original EBR-bench, reached in over half its attempts via one card | Epoch AI | B | |
| 40.1% / 40.4% vs 20.0% | Radiology residents' accuracy on cases where GPT-5.4 was wrong, with two AI suggestions vs one | arXiv (3 hospitals, China) | A | |
| 46.3% to 61.5% | Mean diagnostic accuracy of all 123 residents before and after AI assistance | arXiv (3 hospitals, China) | A | |
| 65.0% | Accuracy of each of the three AI models on the 60-case set | arXiv (3 hospitals, China) | A | |
| 1 h 25 min, ~$74 | Claude Opus 5.5 run time and API cost, with 6 parallel subagents | Quesma (Piotr Migdal) | B | |
| 53 min, ~$10 | GPT-6 Astra run time and API cost at medium effort | Quesma (Piotr Migdal) | B | |
| ~7 agent-hours | Total subagent time inside Opus 5.5's 1 h 25 min run | Quesma (Piotr Migdal) | B | |
| >80% | Share of GPT-5.6 Luna's search queries that use quotation marks in Artificial Analysis runs | Yandex for ML (Practical ML Conf) | B | |
| 2-2.5x | Ouroboros running cost relative to Claude Code, due to more memory kept in context | Yandex for ML (Practical ML Conf) | B | |
| 10 | Claude Code skills built over about two months, covering the full QA workflow | Banki.ru (Habr) | B | |
| +0.031 (p = .157) | Pooled bias-magnitude difference, reasoning minus non-reasoning models; reasoning models were not less biased | arXiv | A | |
| +2.0pp to -0.25pp | A real eval improvement turned negative by a judge only three points less sensitive on treated outputs | Spotify | A | |
| 0.023 | Pooled corrected R-squared between LLM-judge eval effects and click-through effects on 183 Upworthy interventions | Spotify | A | |
| 12.6% | Tasks solved in both modes where concurrency was at least 20% faster | Fudan University | A | |
| $3.42 vs $0.041 | Cost per check of the Opus configuration versus the Qwen configuration, about 83x | Yandex Infrastructure (Habr) | A | |
| ~4,000 | Open problems posed to the internal model over the evaluation | OpenAI | B | |
| 85.8 tok/s | Decode speed for LFM2.5-230M with 4-bit weights on the FPGA card (device time) | FeSens (GitHub) | B | |
| 3.95 tok/s | Decode speed for the 34.7B-parameter Qwen3.5-35B-A3B MoE model with experts streamed from host storage | FeSens (GitHub) | B | |
| 40-45% | Decode speed gain from 4-bit weights versus int8 | FeSens (GitHub) | B | |
| ~5x | API-equivalent value of Claude plans vs OpenAI plans at the mid-tier models (Opus 5.5 vs GPT 6.1 Sol) | SemiAnalysis | B | |
| -369% vs 1% | Estimated gross margin at full utilisation for maxed-out Opus 5.5 vs Fable 5.1 usage | SemiAnalysis | B | |
| 48.6% | Share of LLM reasoning steps users judged as AI-initiated, work they had not asked for | KAIST | A | |
| 47% | Of runs in which DeepSeek-V4-Pro disabled monitoring in the dual-channel setup | arXiv | A | |
| 0.81 | Accuracy ratio when the model answers directly in cablese instead of plaintext | Five Minutes Forward (Travis Smith) | B | |
| 13% | Median share of hard tasks whose outcome flips, both when swapping the harness and when rerunning the same one | arXiv | A | |
| 16,581 / 7,025 / 829 | Tokens of fixed preamble sent every step by Claude Code, OpenCode and mini-SWE-agent | arXiv | A | |
| 71% | Of early web-enabled DeepSeek and Qwen trials that fetched the upstream fix from GitHub | arXiv | A | |
| 3.0%-97.9% | Share of responses LLM judges rated acceptable, versus 61.1% for occupation-matched workers | MIT FutureTech | A | |
| 68.4% | Occupations where the harshest judge (Opus) disagreed with the worker majority verdict | MIT FutureTech | A | |
| 40.2 pp | Largest gap in 128K-context retrieval accuracy across token phases in DeepSeek-V4 base models | ByteDance Seed (arXiv) | A | |
| 55% / 86% | Operate a formal AI harness layer, whole sample / organizations with established ROI | KPMG | A | |
| 23% | Include model routing in their AI management layer, the least common capability | KPMG | A | |
| 0.1-0.2 pp | Estimated rise in the US natural rate of unemployment since LLMs were introduced, through mid-2026 | Federal Reserve Board | A | |
| 65% | AI success rate at end-2025 on tasks taking humans three to four hours | Brookings / MIT FutureTech | B | |
| 2.5 years | Approximate halving time of LLM failure rates (Mertens et al.) | Brookings / MIT FutureTech | B | |
| >100x | Reduction in propensity to compromise out-of-scope infrastructure when OpenAI used its production Codex harness and prompt | Kapoor and Narayanan | S | |
| ~1% vs ~50% | Share of actions flagged by an Anthropic monitor with the model's chain of thought included versus stripped | Kapoor and Narayanan | S | |
| 5.6% to 17.3% | Global systemic exclusion rate, base models versus post-trained models | arXiv | A | |
| 19 pp | Drop in correct solutions on a task outside the AI frontier in the 758-consultant field experiment the paper cites | arXiv | B | |
| 1.242 SD vs 0.834 SD | AI effect on task score for lower- vs higher-education participants | arXiv | A | |
| 87% | LLM calls initiated by the agent rather than the user | Microsoft Research | A | |
| 0.237 vs 0.122 | Gap between strongest and weakest model on average vs best-of-three score | arXiv | A | |
| $89.9 vs $16.5 | Mean cost per task for Claude Opus 4.7 vs GPT-5.5 | arXiv | A | |
| 2/6 and 1/6 | Overall scores the original authors gave the two agent-written papers; both unambiguous rejections | arXiv | A | |
| <50% | Share of the API budget the OpenClaw/Opus 4.8 agents spent before stopping | arXiv | A | |
| 0.37 points | Average AI-autonomy gap (1-5 scale) between Claude Code and chat/Cowork for the same output types | Anthropic | A | |
| 0.974 | Scaled AI exposure score for lawyers, the worked example | PwC | A | |
| 56% | Benchmark score of the best model, Claude Opus 4.7, across 25 target programs | Epoch AI | A | |
| 14 hours, $251 | Time and cost for Opus 4.7 to reimplement gotree (about 16,000 lines of Go), passing 2,000/2,001 tests | Epoch AI | A | |
| 54% | Of organizations say AI is making candidate evaluation harder | Manpower Everest | B | |
| 19% | AI users in the Frontier zone, where individual capability and organisational readiness are both high | Microsoft WorkLab | A | |
| 5x | Increase in app usage time with the LLM coach versus a no-LLM control, while physical activity stayed comparable (N=54, four weeks) | Stanford | B | |
| over 93% | Share of GPTCoach conversational strategies coded by experts as consistent with motivational interviewing or neutral | Stanford | B | |
| 47% | Of about 575,000 student conversations on Claude.ai that sought answers with minimal cognitive engagement (Anthropic, cited) | World Economic Forum | B | |
| 12% to ~66% | Jump in AI agent task success on OSWorld, real computer tasks across operating systems | Stanford HAI | S | |
| nearly 1,000% | Growth in DeepSeek model downloads on model-sharing platforms since R1's release in January 2025 (US CAISI) | RAND | B |